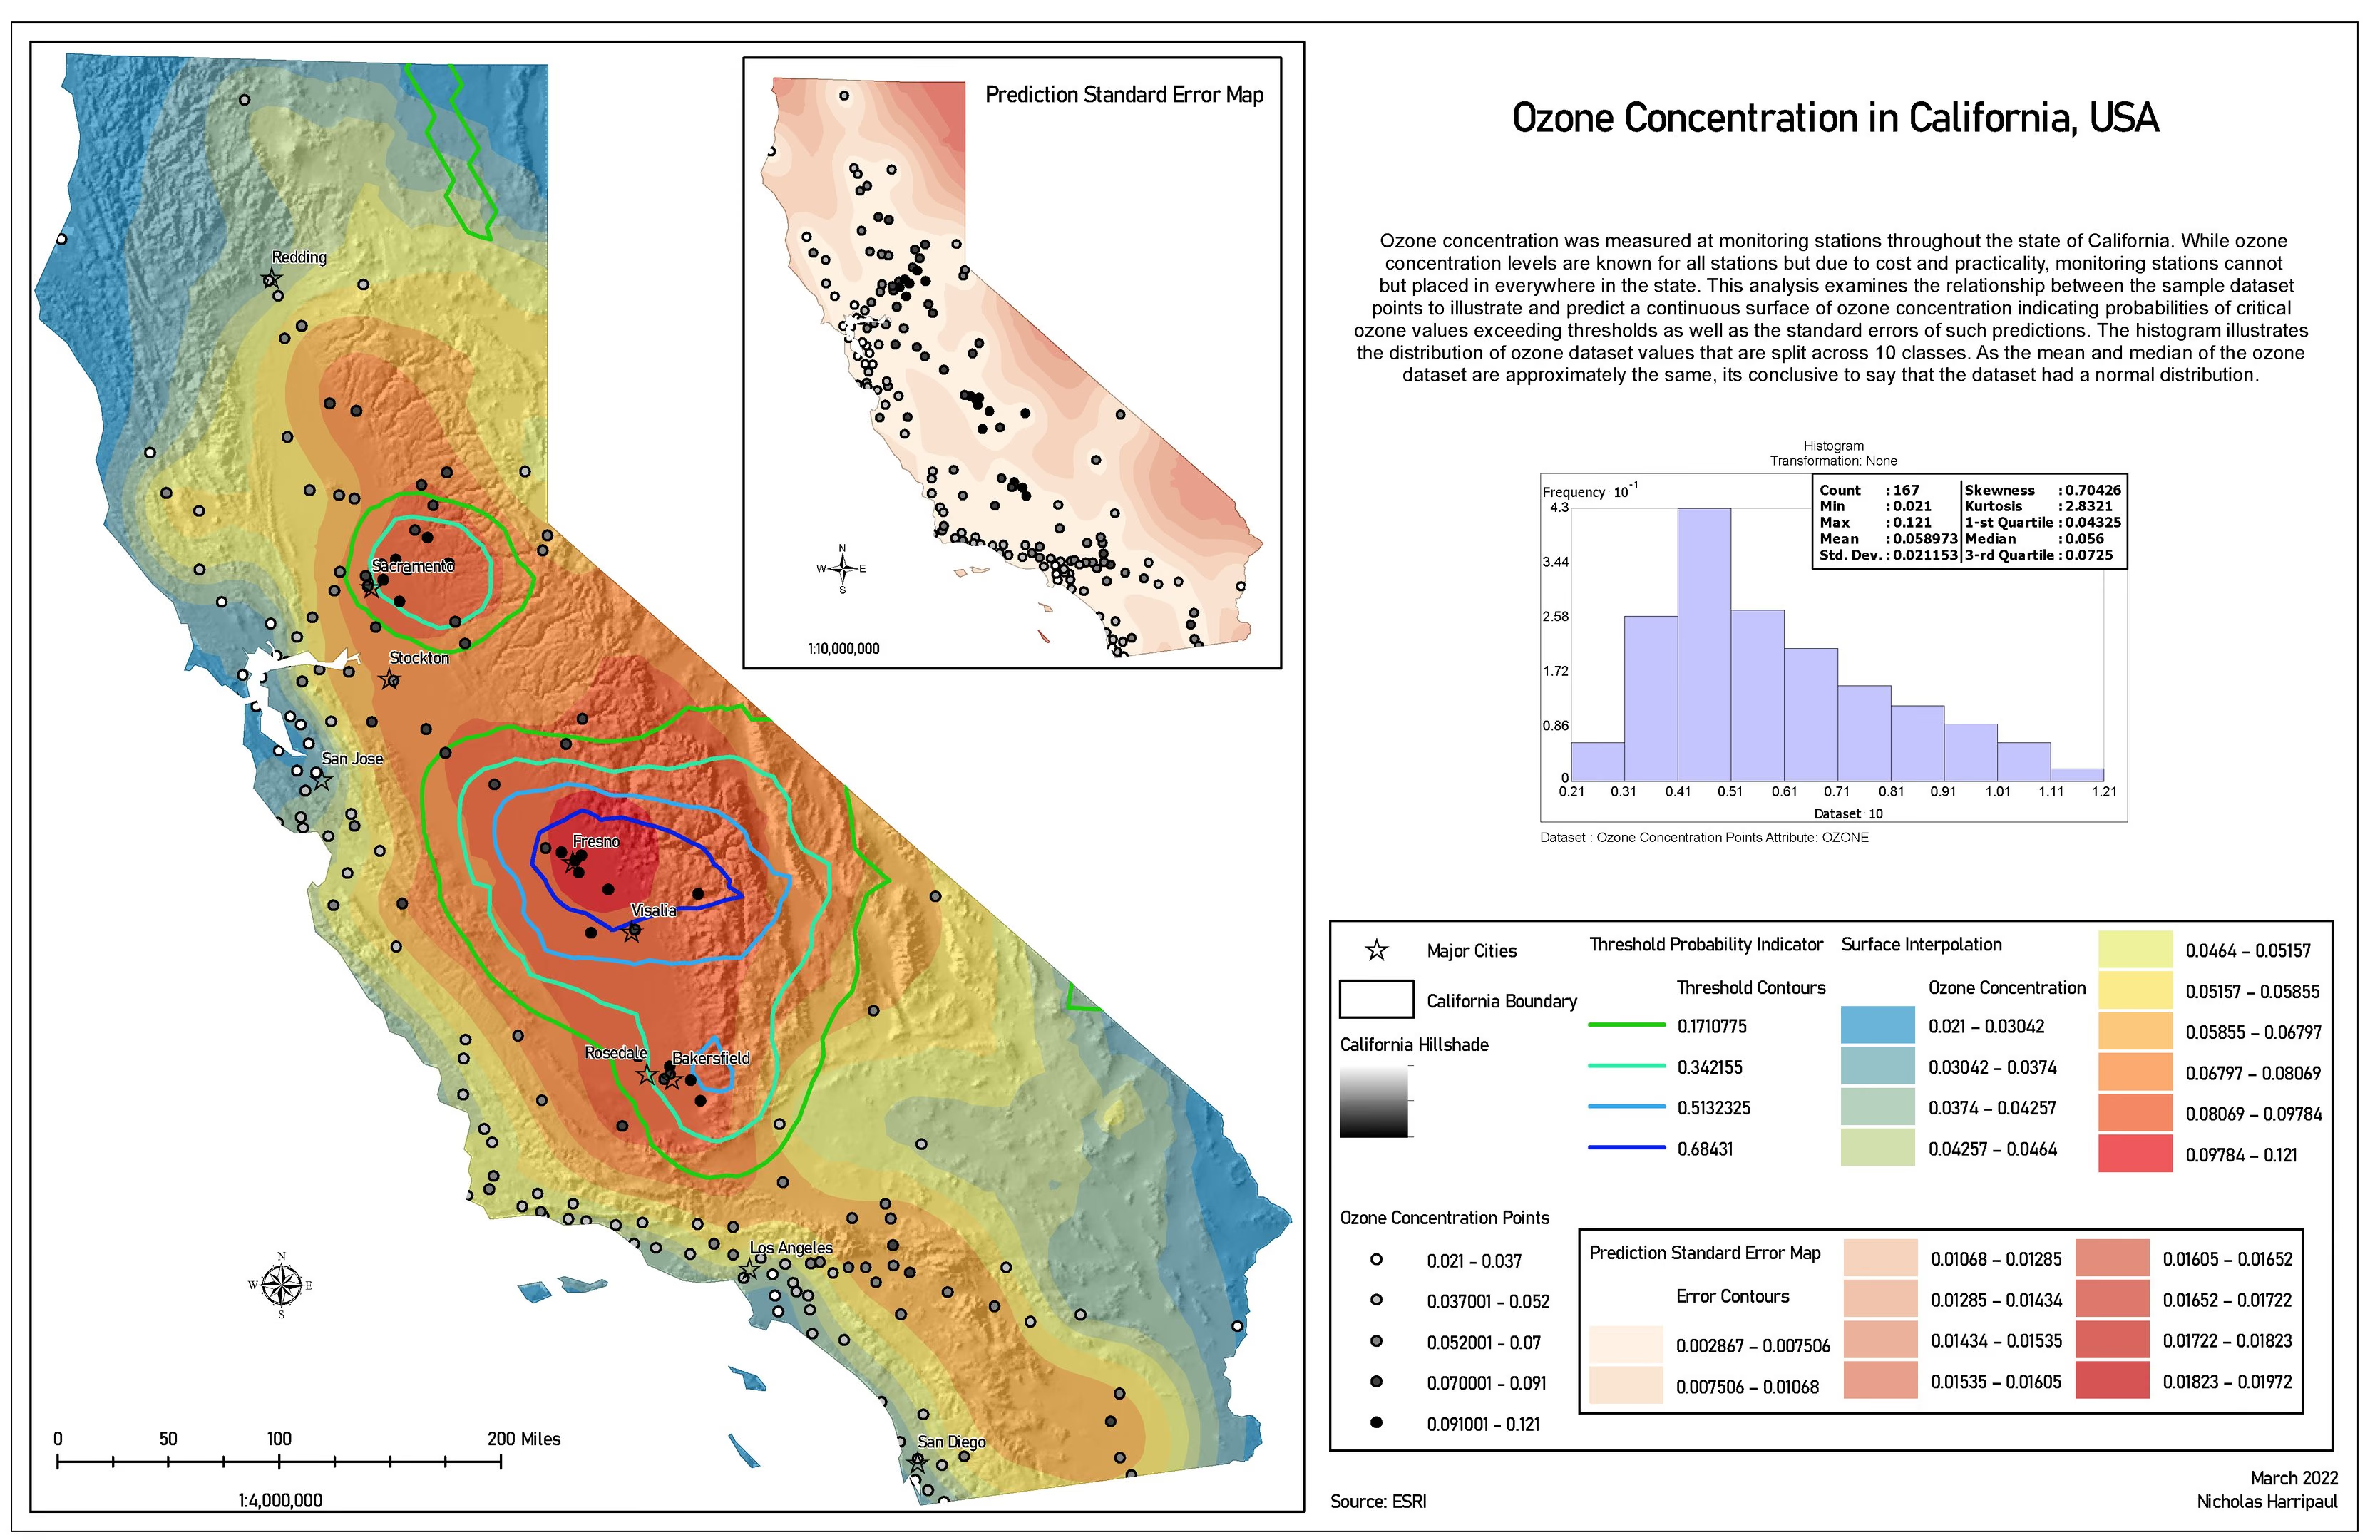
Ozone concentration across California
Ordinary kriging from sparse monitoring stations to a continuous surface, against the health standard
Academic coursework / 2021-2022
Notes on method
Kriging turns a few dozen measurements into a value for every location in the state. That is useful and slightly dangerous: the output looks equally confident everywhere, and it is not.
Keeping the monitoring stations visible on top of the interpolated surface is the cheapest honest thing a map like this can do. Where the dots are dense, the surface is interpolation. Where they are sparse, it is extrapolation wearing the same colours, and a reader can see which is which without being told.
Ordinary kriging was chosen over inverse distance weighting because the semivariogram showed structure worth modelling rather than a simple distance decay.