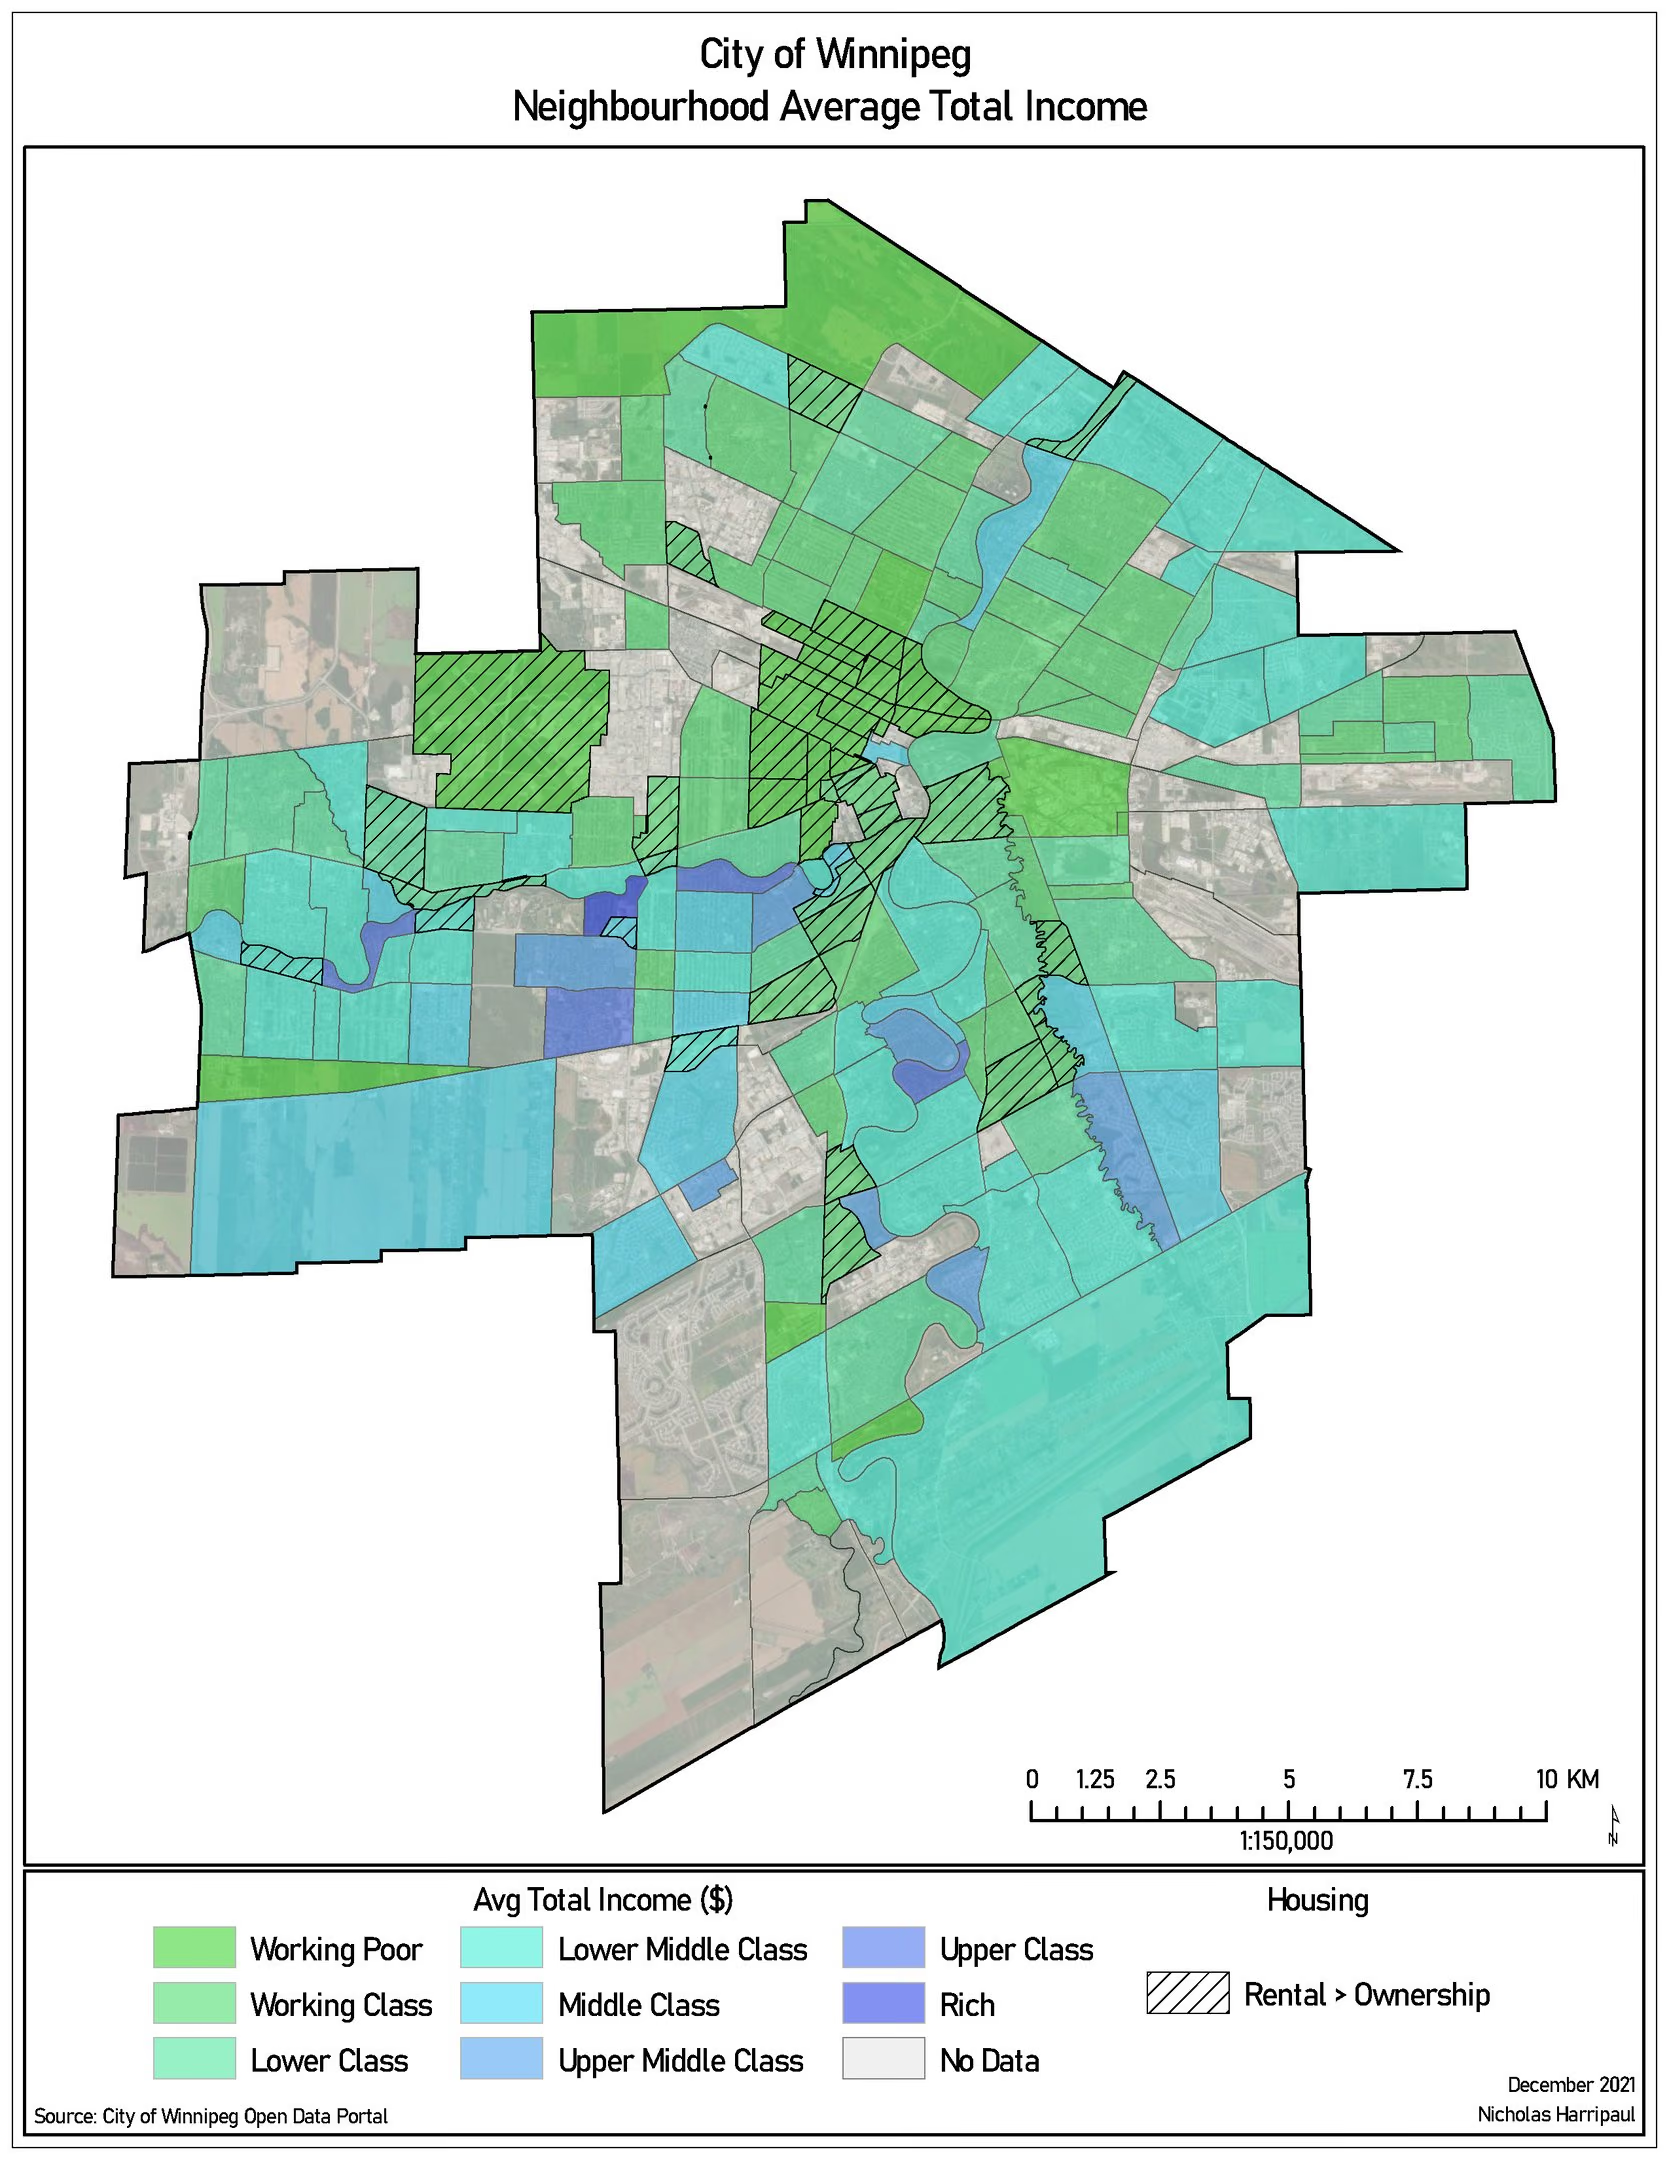
Winnipeg neighbourhood income
Average total income by neighbourhood, classified into named income bands rather than numeric quantiles
Academic coursework / 2021-2022
Notes on method
Two decisions carry this map.
The classes are named. Labelling a band “working poor” rather than giving its dollar range makes a claim that the numeric version hides behind, and a claim like that should be made visibly or not at all. It also means the legend has to be defended, which is the right pressure to be under.
No-data neighbourhoods are their own grey. The common alternatives both lie: drop them and the map implies the city is fully covered; fold them into the lowest class and the map invents poverty. Absence of data is a finding about the data, and it belongs in the legend.