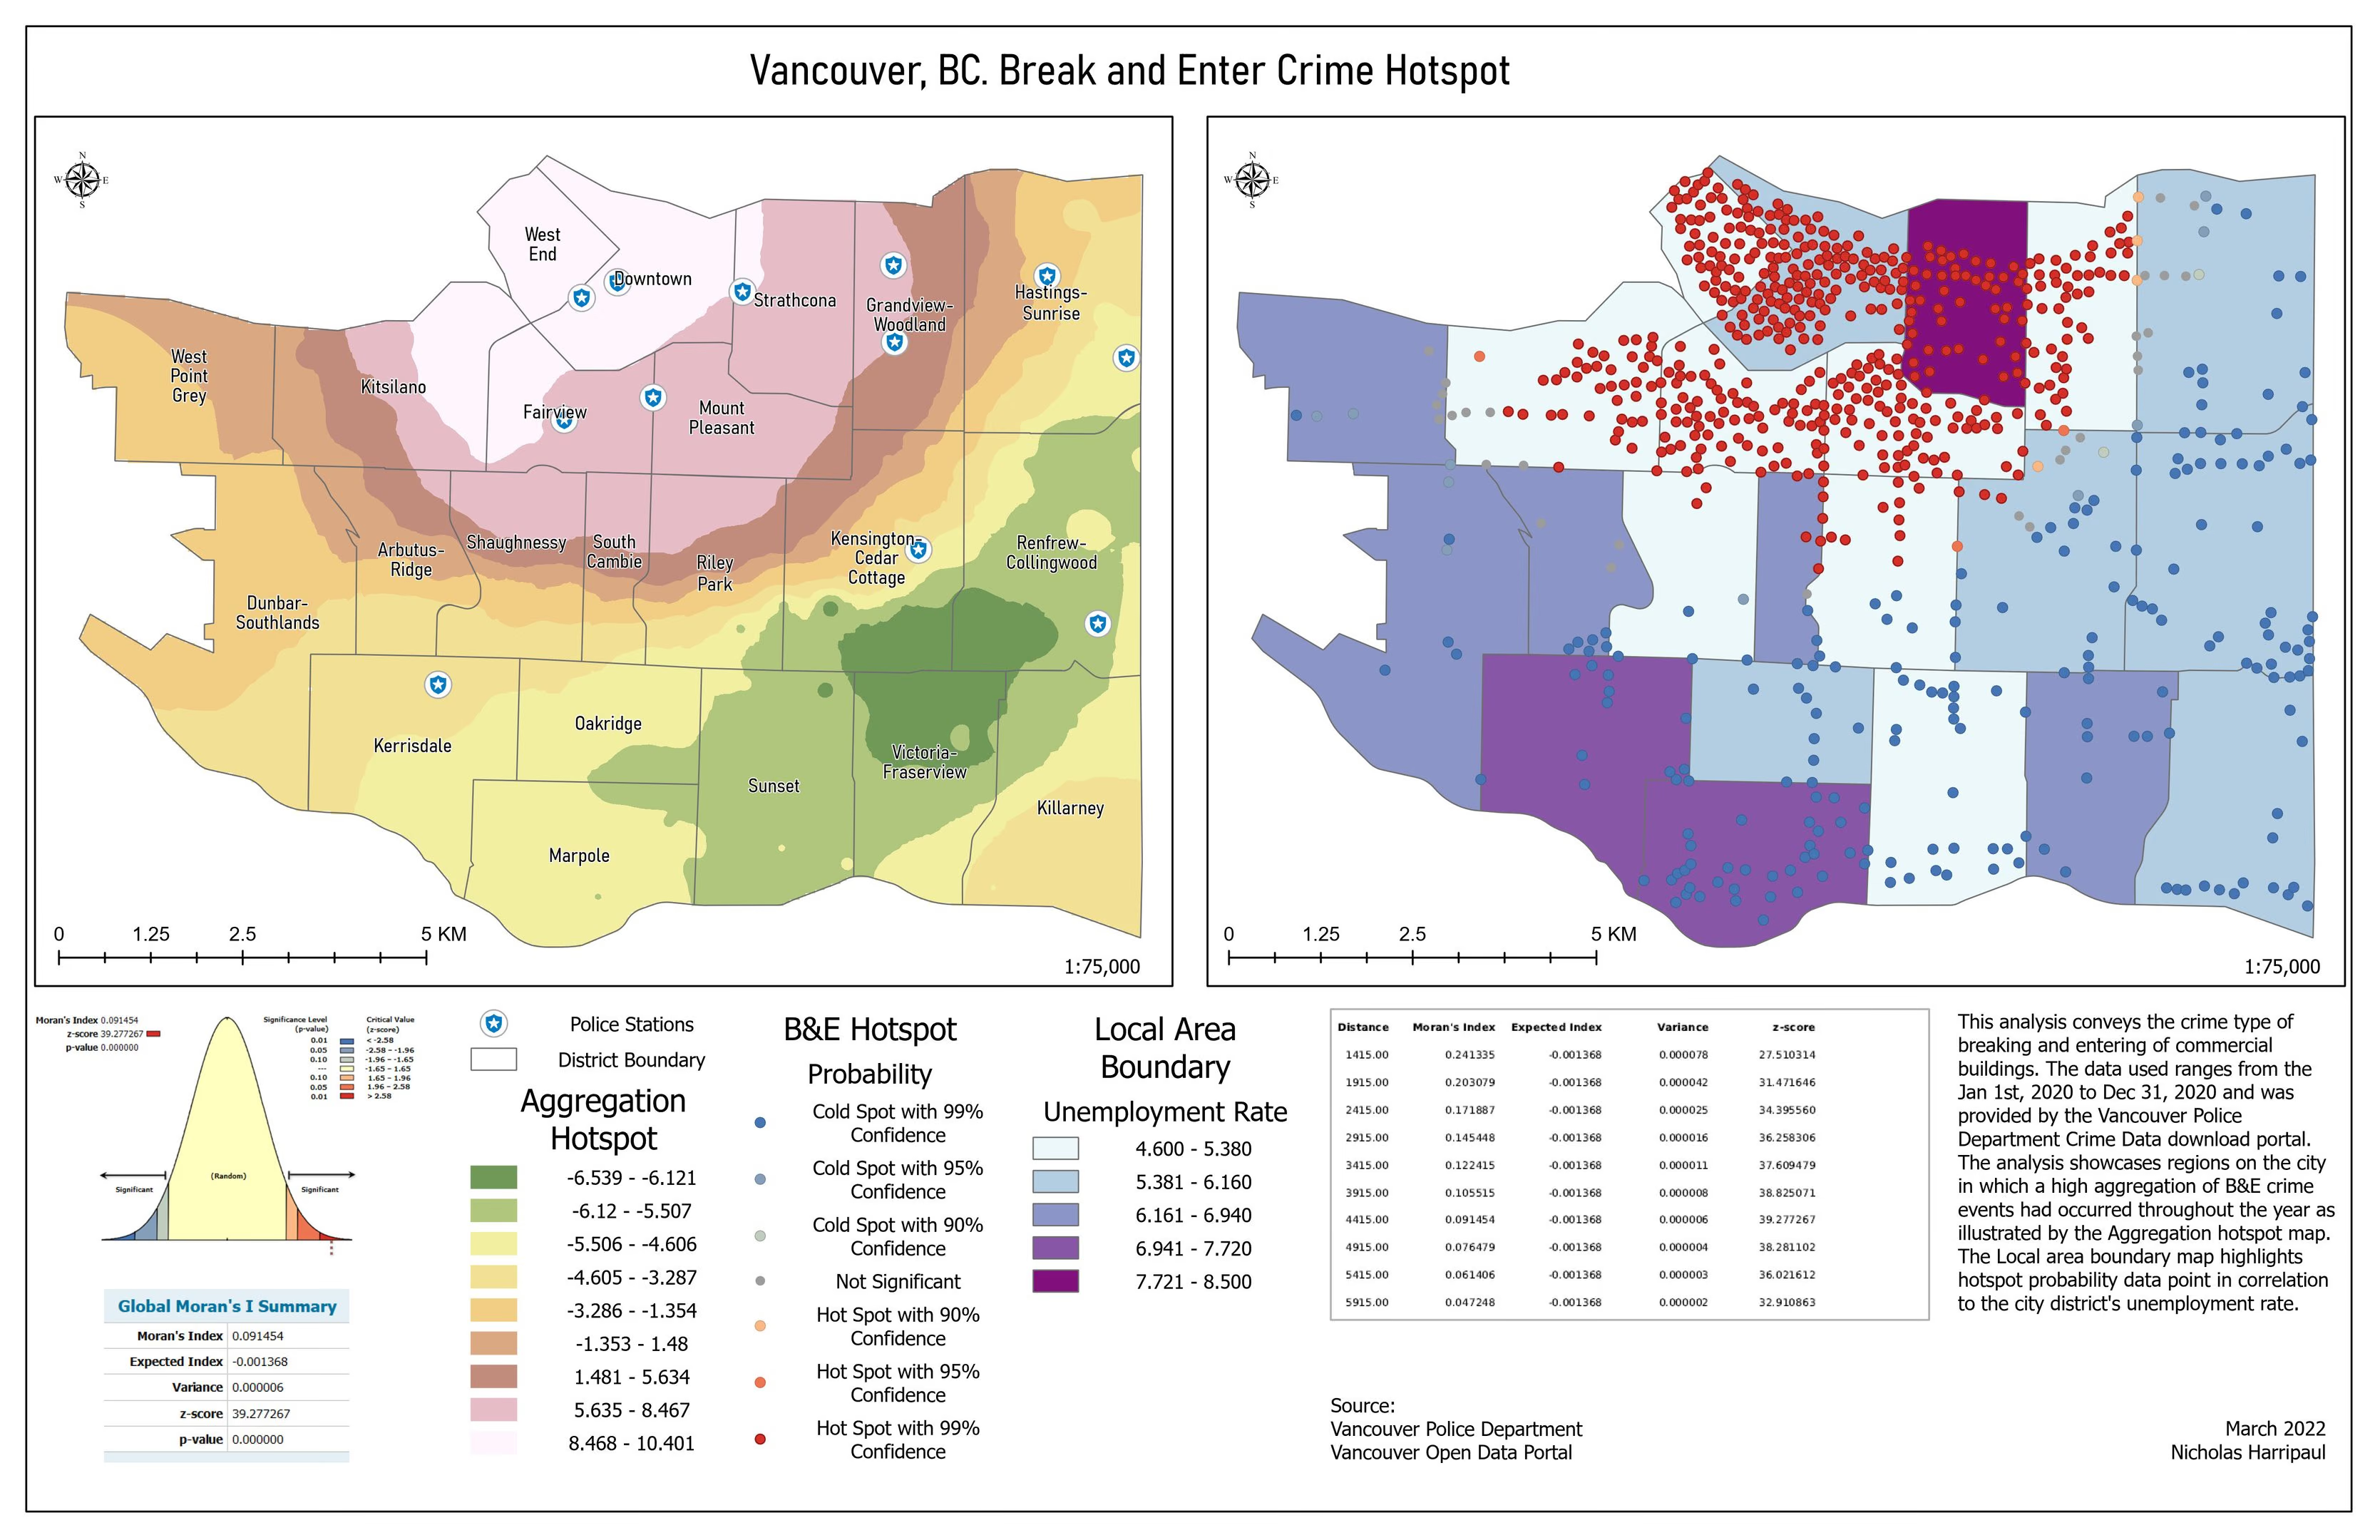
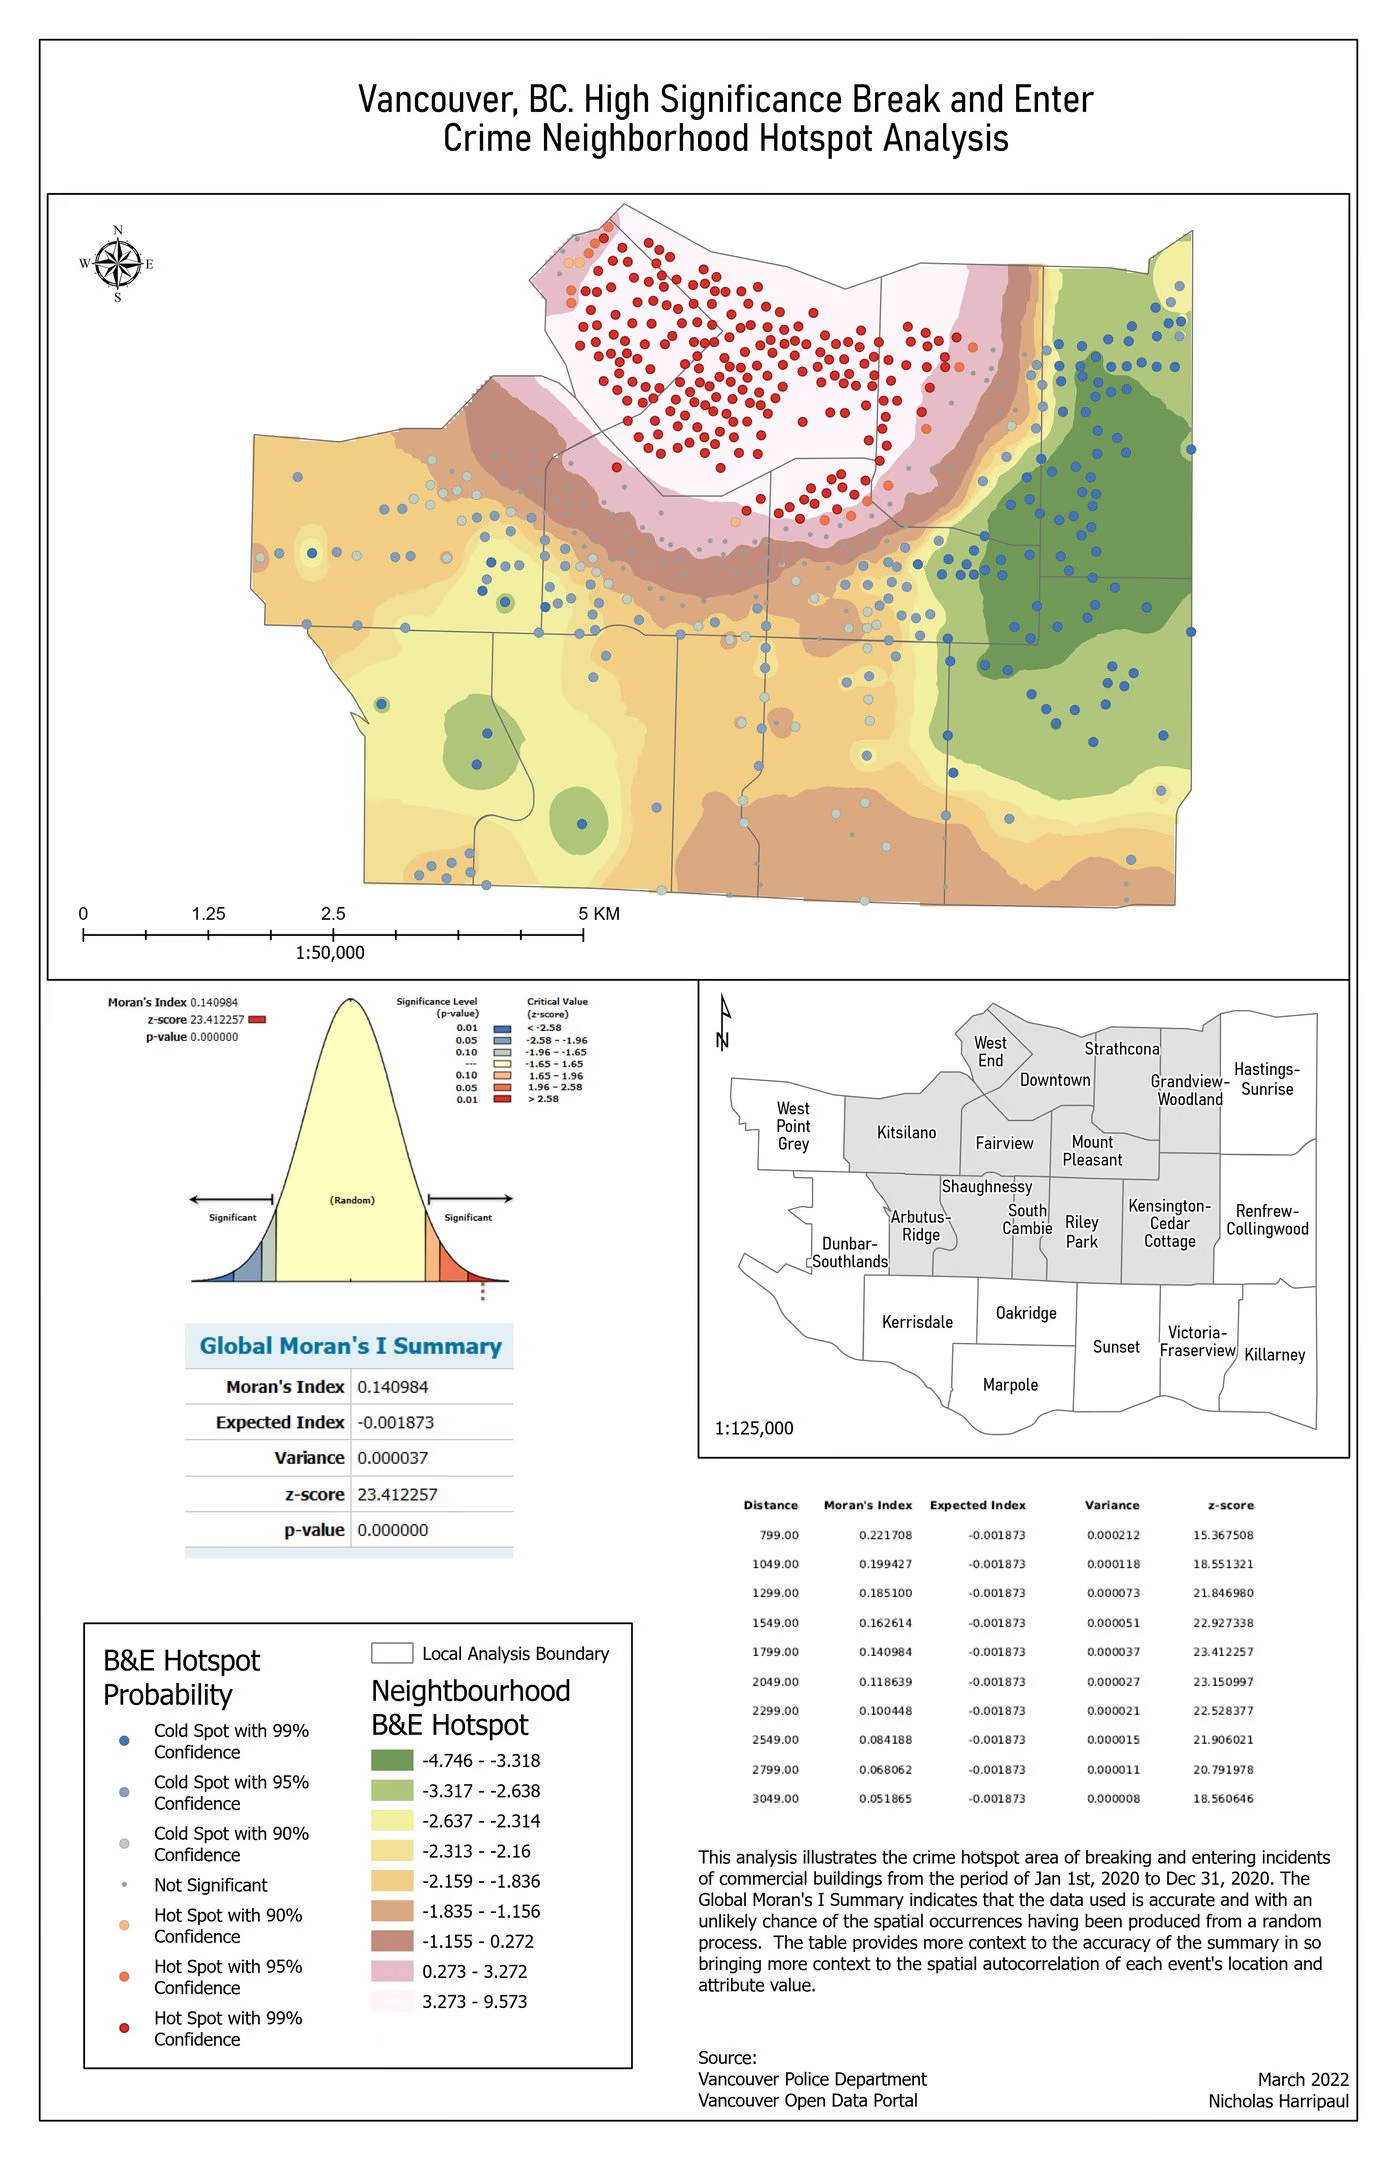
Vancouver break-and-enter hotspots
Getis-Ord Gi* on geocoded police reports, with the global statistic reported alongside the map
Academic coursework / 2021-2022
Notes on method
Hot spot maps are easy to produce and easy to over-read. A Gi* surface will always render something, and a reader who sees red assumes a finding.
So the global statistic is on the plate. Global Moran’s I returns a z-score of 39.28 against an expected index of roughly -0.0014, with a p-value that rounds to zero. That tells a reader the clustering is real before they start interpreting where it is, which is the order those two questions should be answered in.
Three confidence bands are shown rather than one. Collapsing 90, 95 and 99 percent into a single “hot spot” category would discard exactly the information that distinguishes a cluster worth acting on from one worth watching.