Terrain modelling from LiDAR

Elevation, slope, aspect and isarithmic profiles across four Manitoba study areas, from raw point cloud up

Academic coursework  /  November 2021 to January 2022

Discipline
Terrain analysis
Tools
ArcGIS, LAStools
Methods
point cloud processing, digital elevation modelling, slope analysis, aspect analysis, isarithmic mapping, terrain profile construction, vertical exaggeration
Data
City of Brandon; Assiniboine Community College

Notes on method

Terrain work starts before the map. A raw LiDAR return is a cloud of points with no opinion about what is ground, vegetation or building, and every surface downstream inherits whatever that classification got wrong.

The pair of Riding Mountain models is the clearest statement in this set. Same terrain, same source, two cell sizes. The coarser raster is not a lower-quality version of the finer one; it is a different claim about what counts as a landform. Choosing between them is an analytical decision, and showing both is how that decision gets discussed rather than assumed.

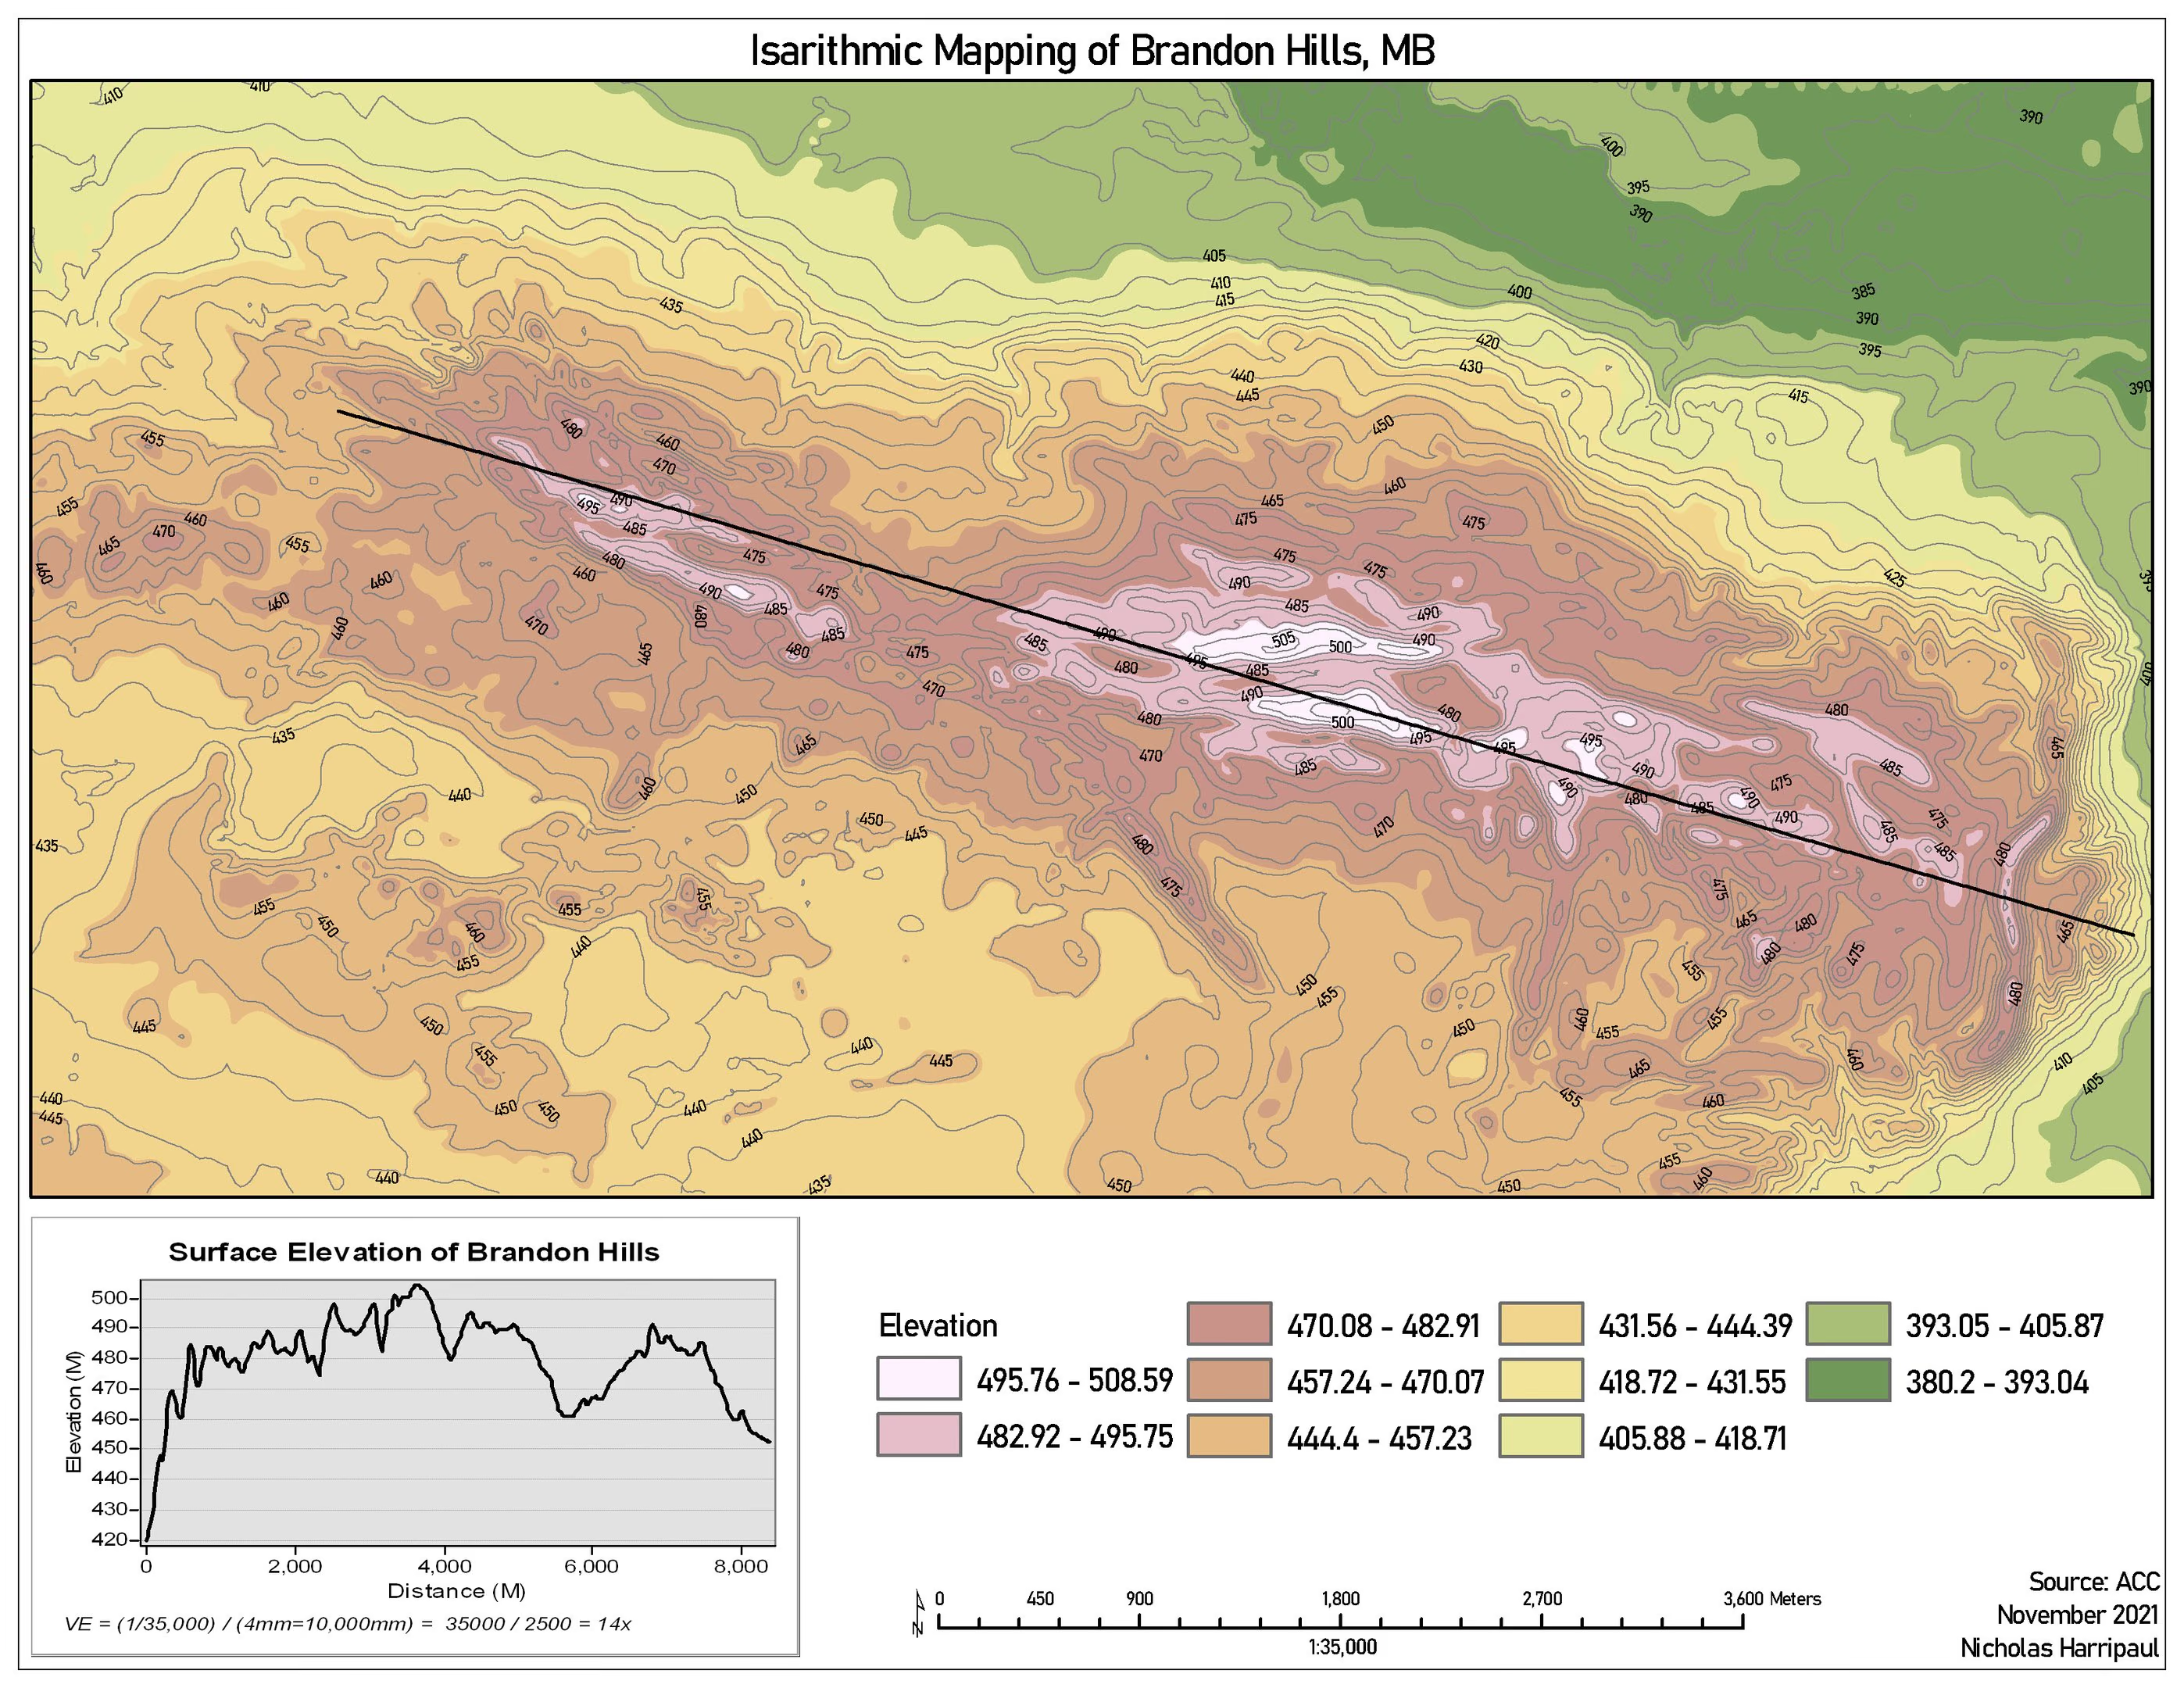
The Brandon Hills profile carries its vertical exaggeration on the plate. At 14x, a 20-metre rise over eight kilometres reads as dramatic relief, and a profile that omits the exaggeration factor is closer to a drawing than a measurement.

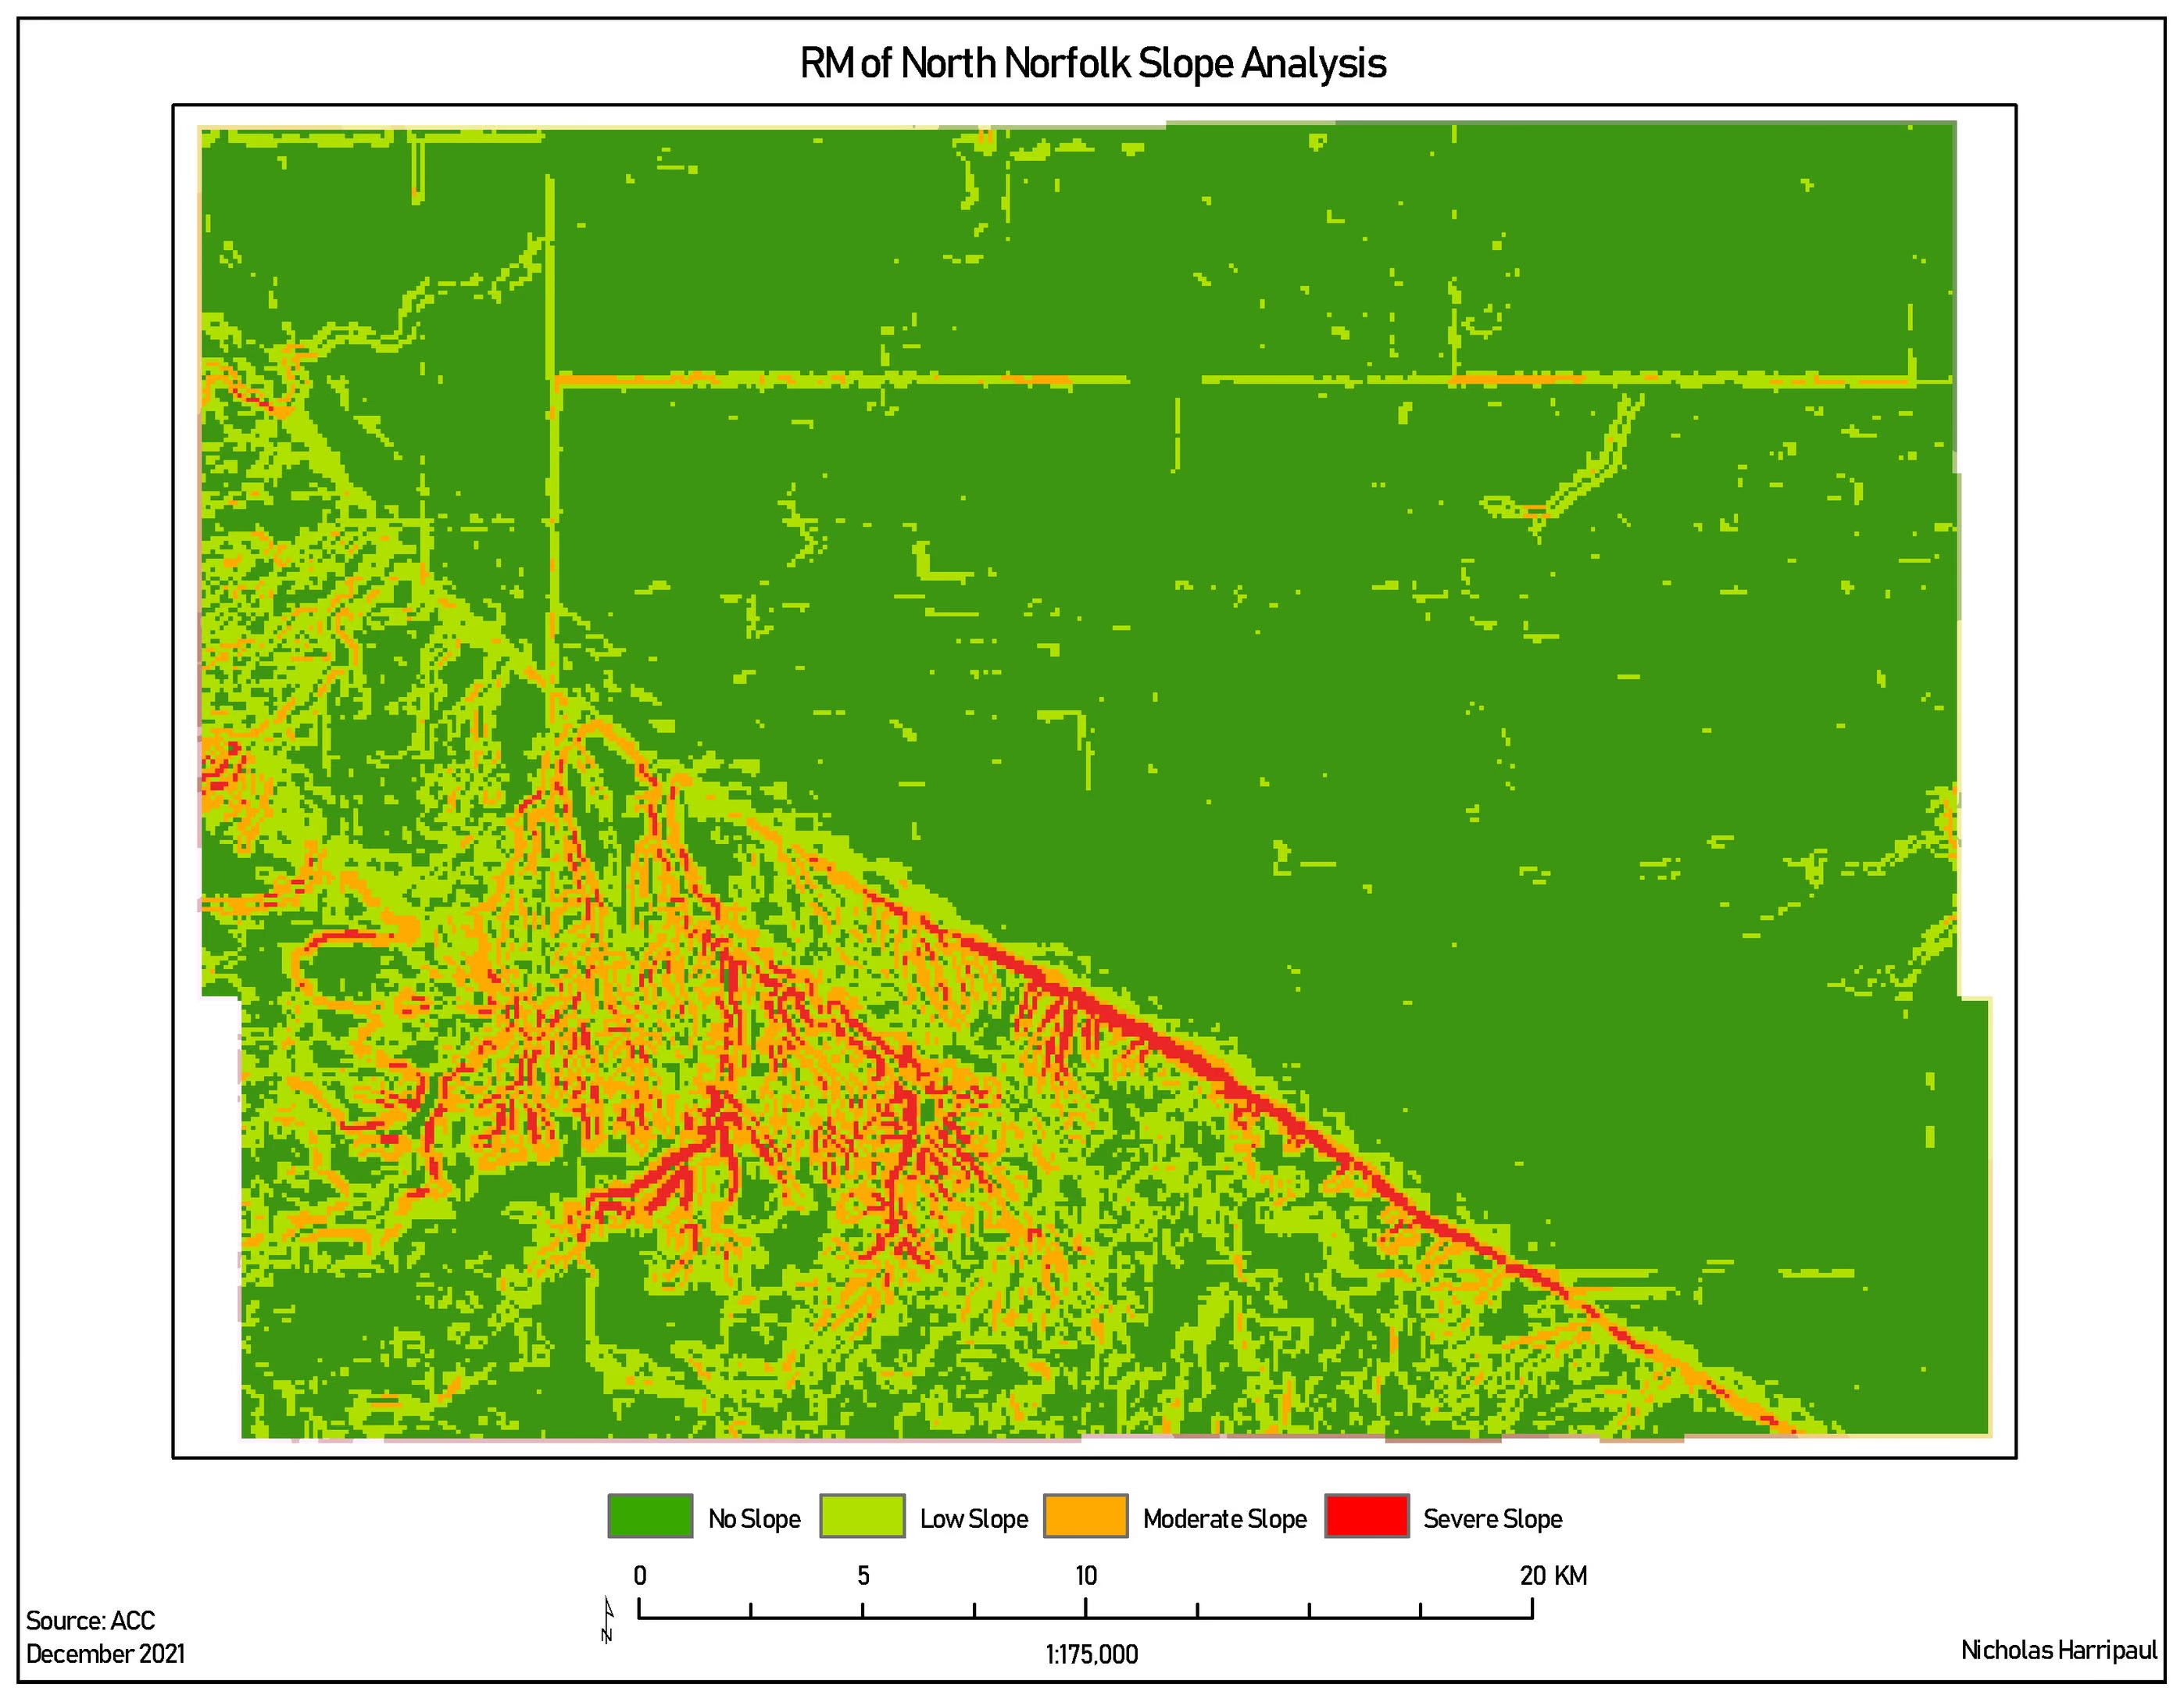
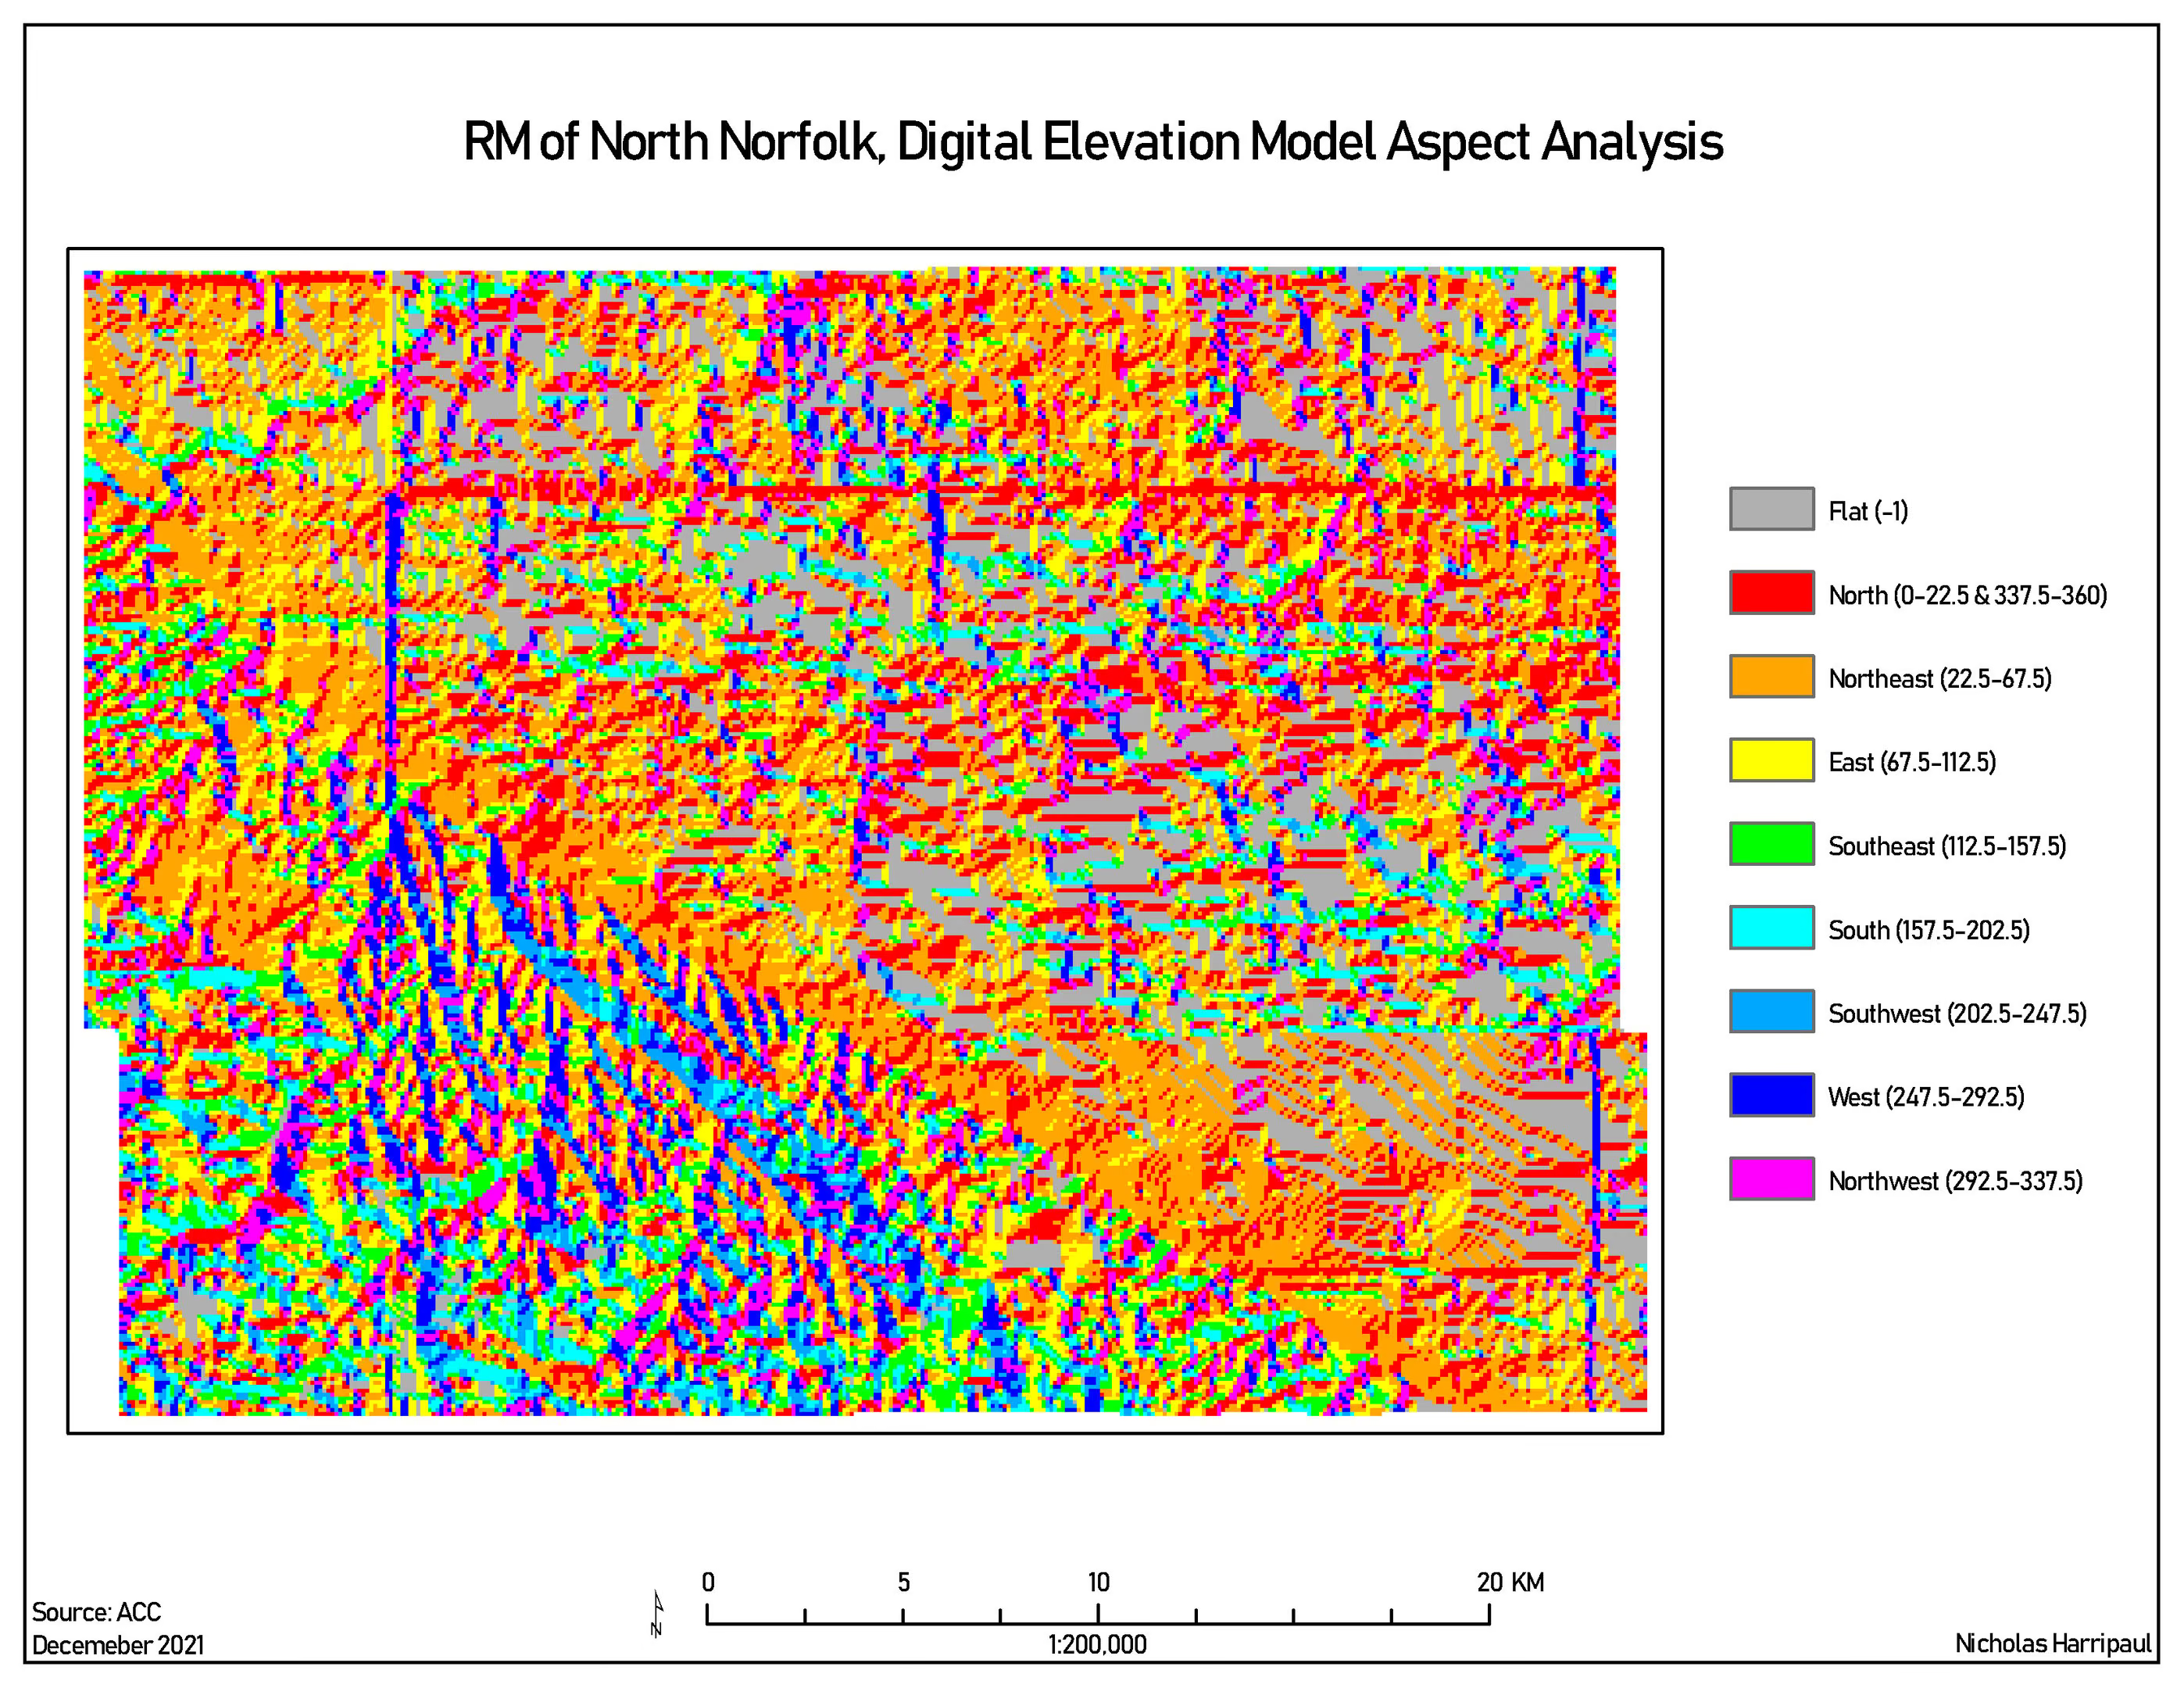
Slope and aspect over the RM of North Norfolk are deliberately a pair. Slope alone says where the land is steep; with aspect it also says which way it faces, which is what determines drainage, exposure and what can be grown.
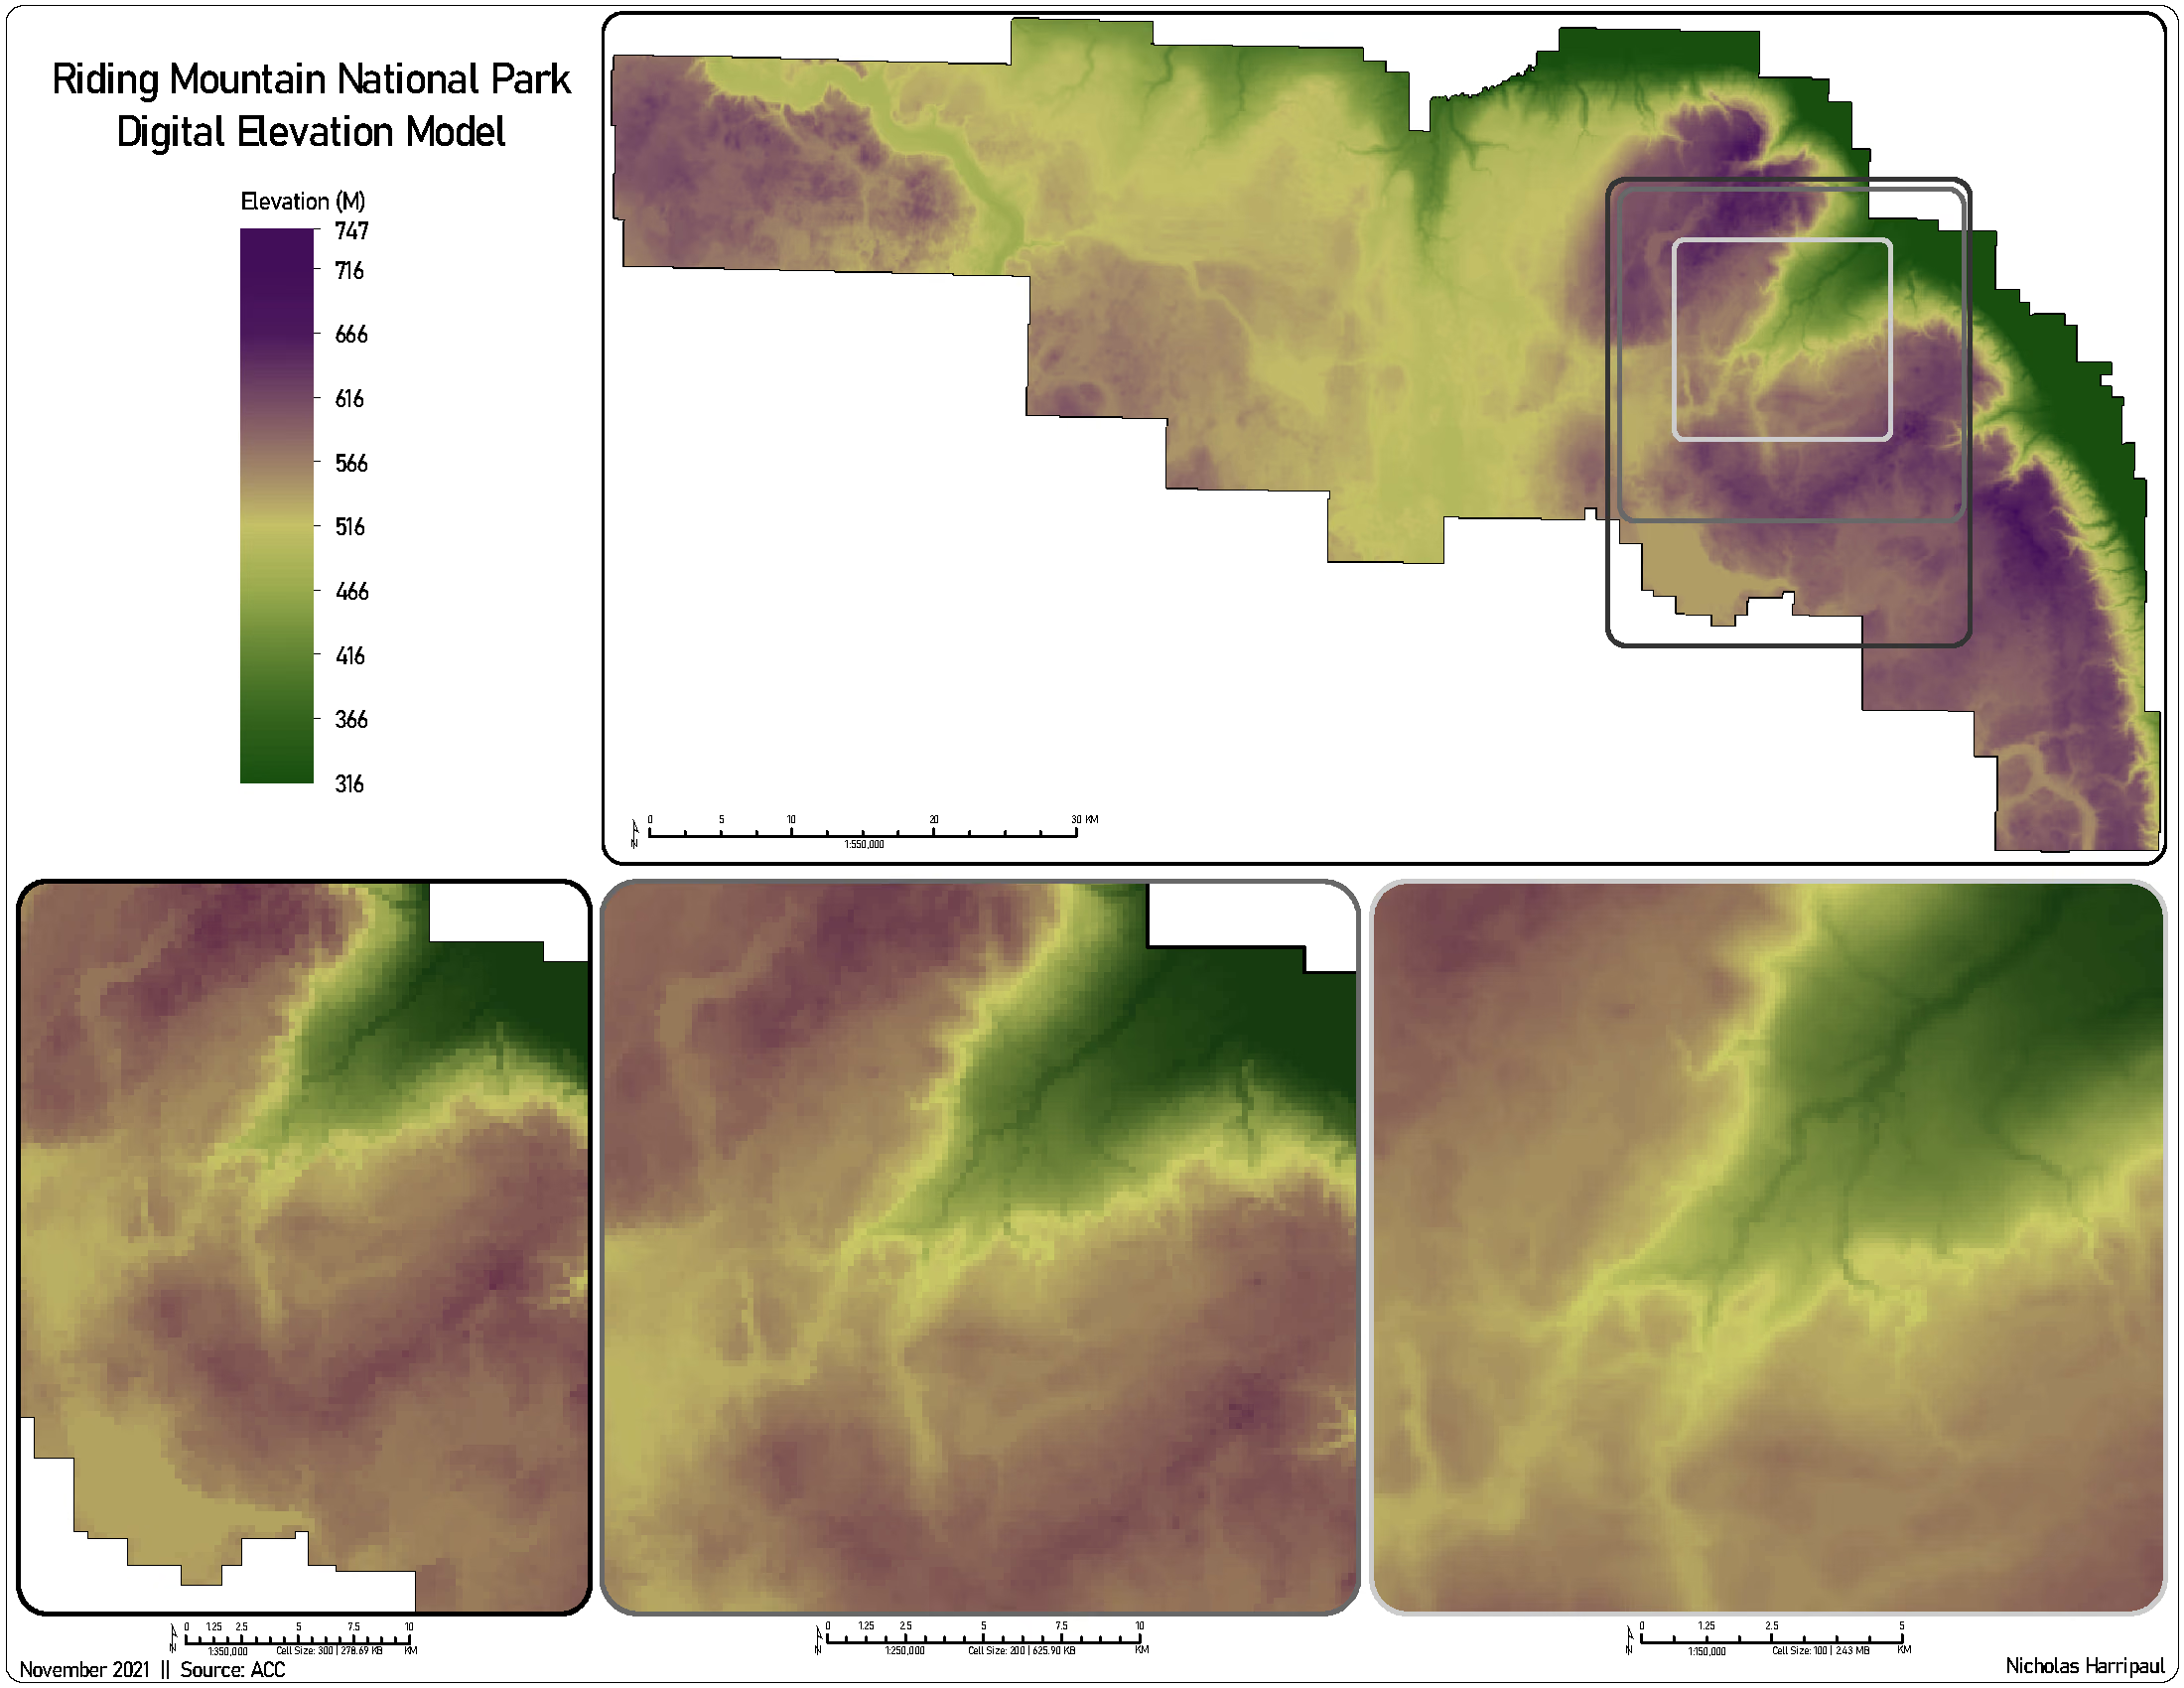
Two digital elevation models of Riding Mountain National Park side by side at 300 metre and 200 metre cell sizes, showing how much terrain detail the coarser raster discards.
The same terrain at two cell sizes, 300 m and 200 m. Resolution is a modelling decision, not a file property, and the pair makes the cost of the coarser one visible.Base data: ACCOpen larger (2200px)
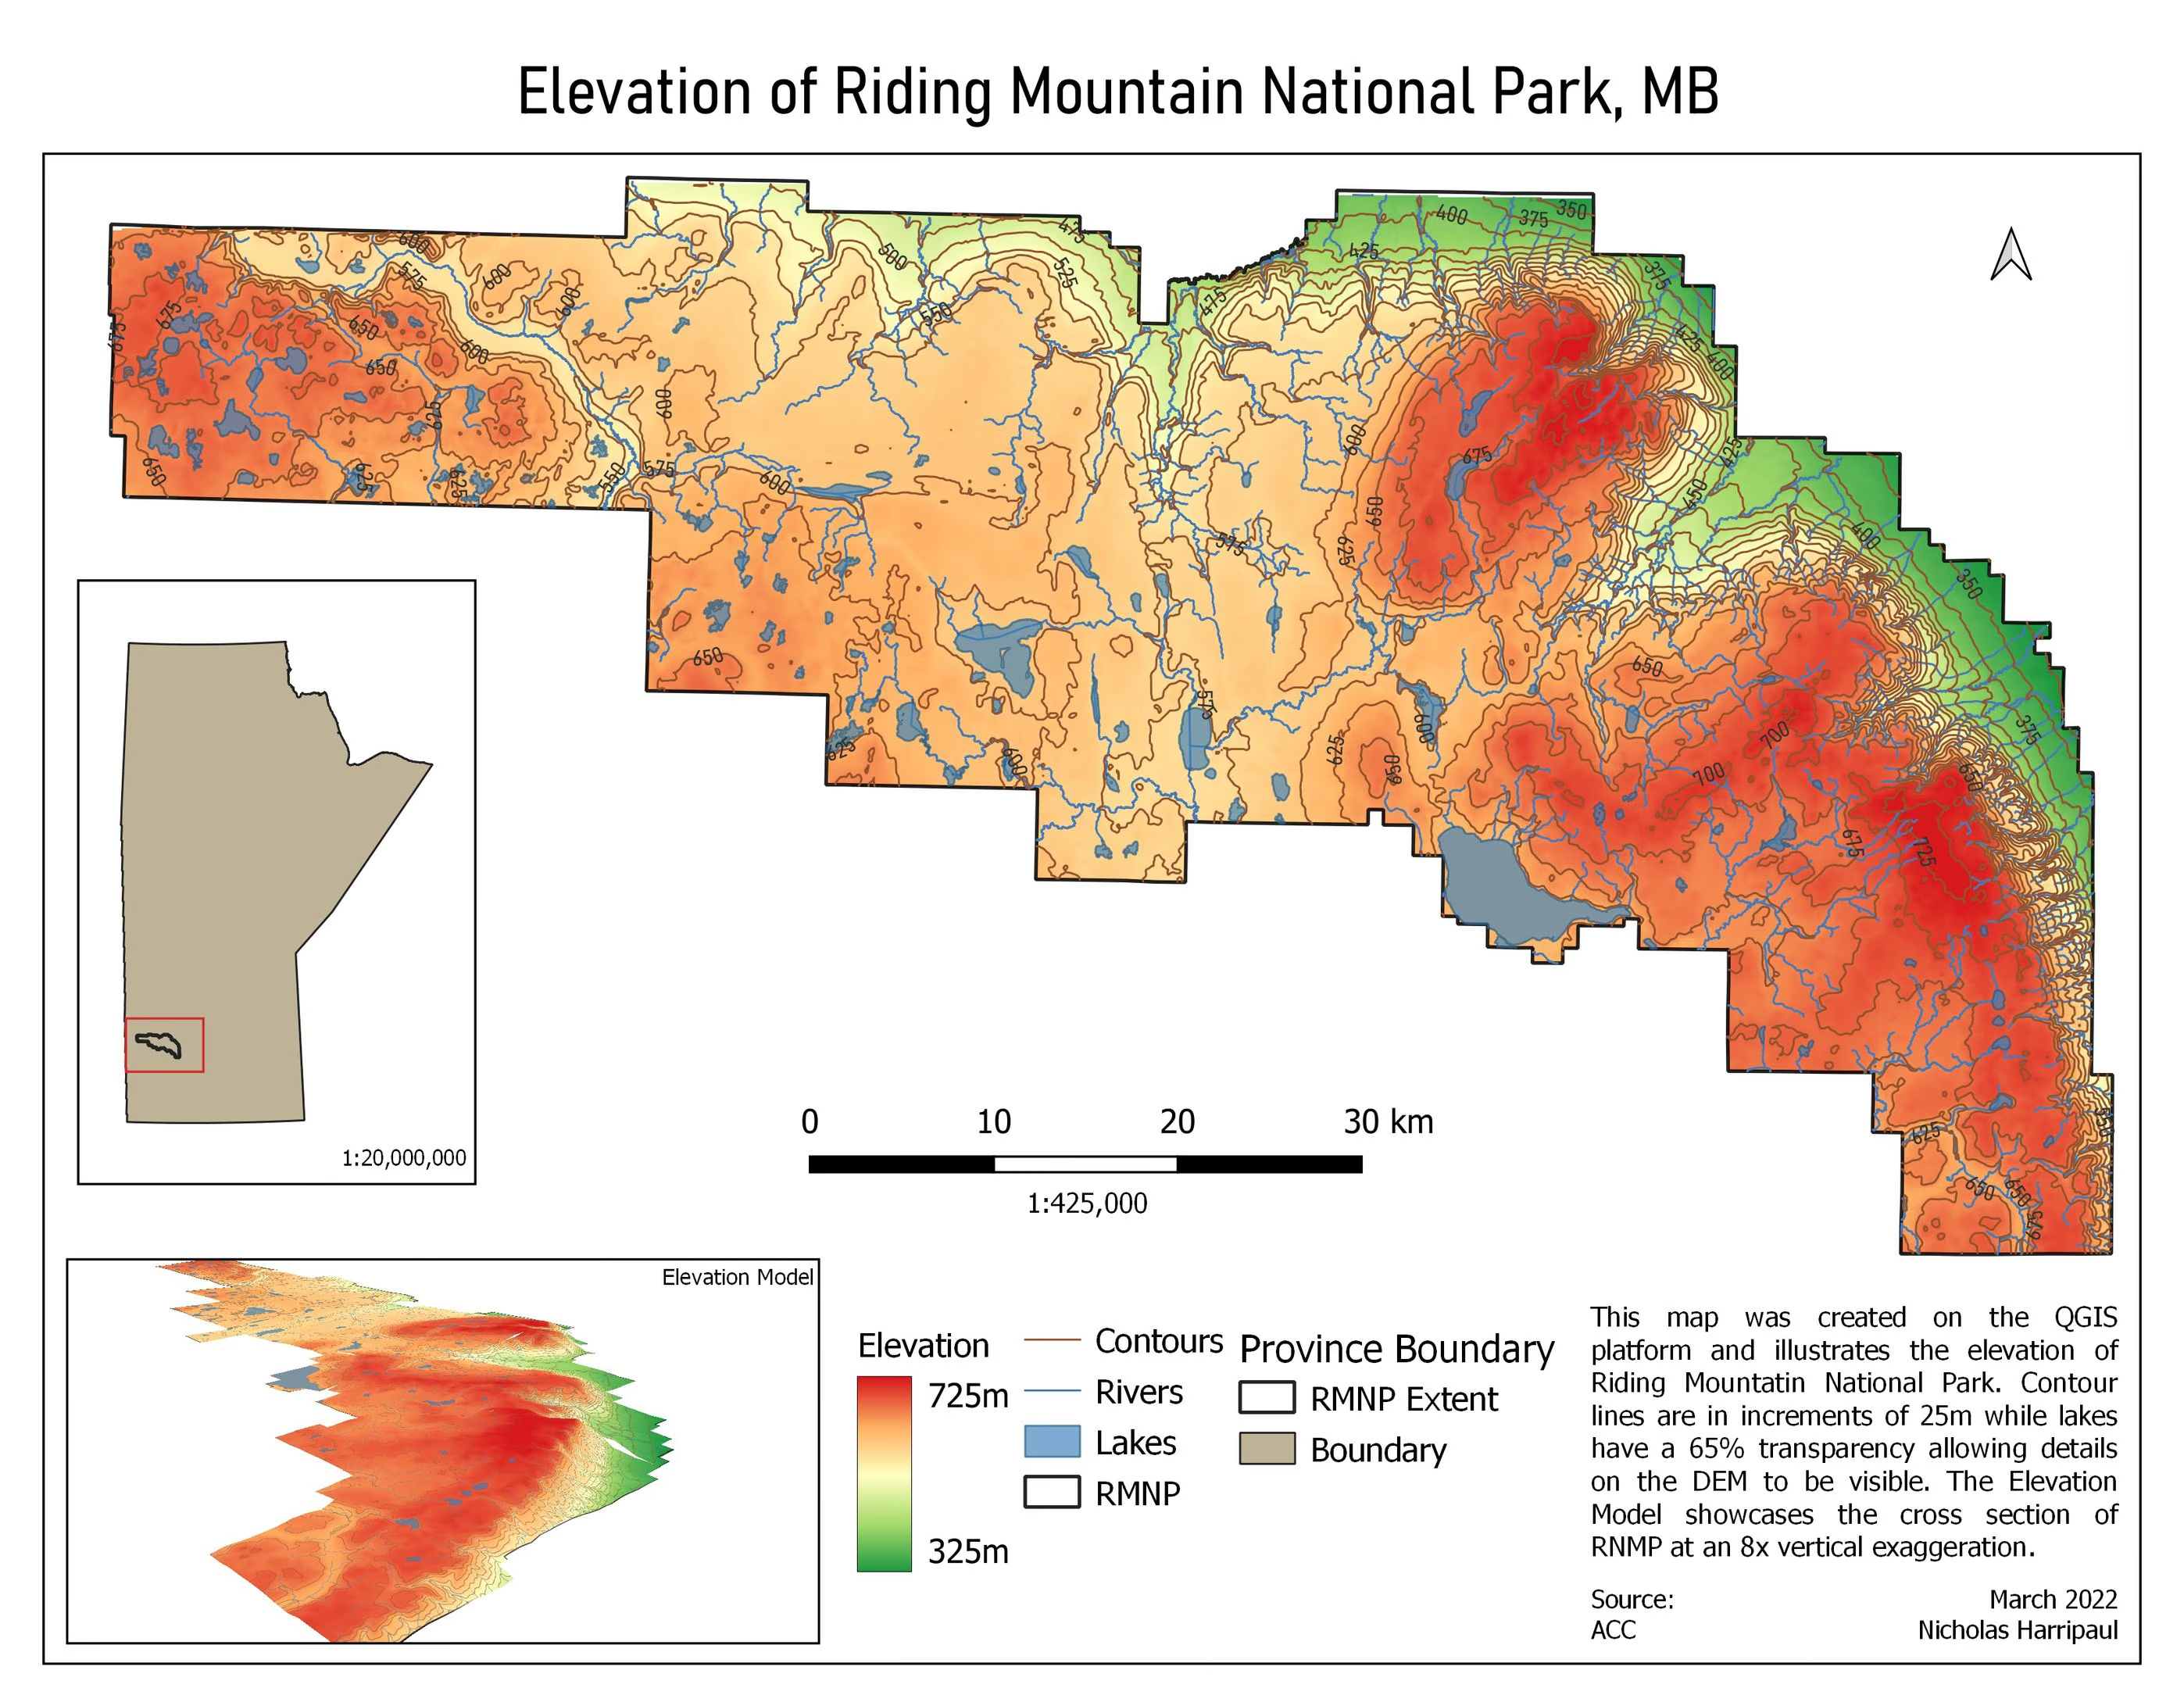
Elevation model of Riding Mountain National Park with contour intervals and a graded ramp reaching 325 metres.
Elevation with contour intervals carried over the ramp, so the surface can be read both continuously and by discrete step.Open larger (2432px)
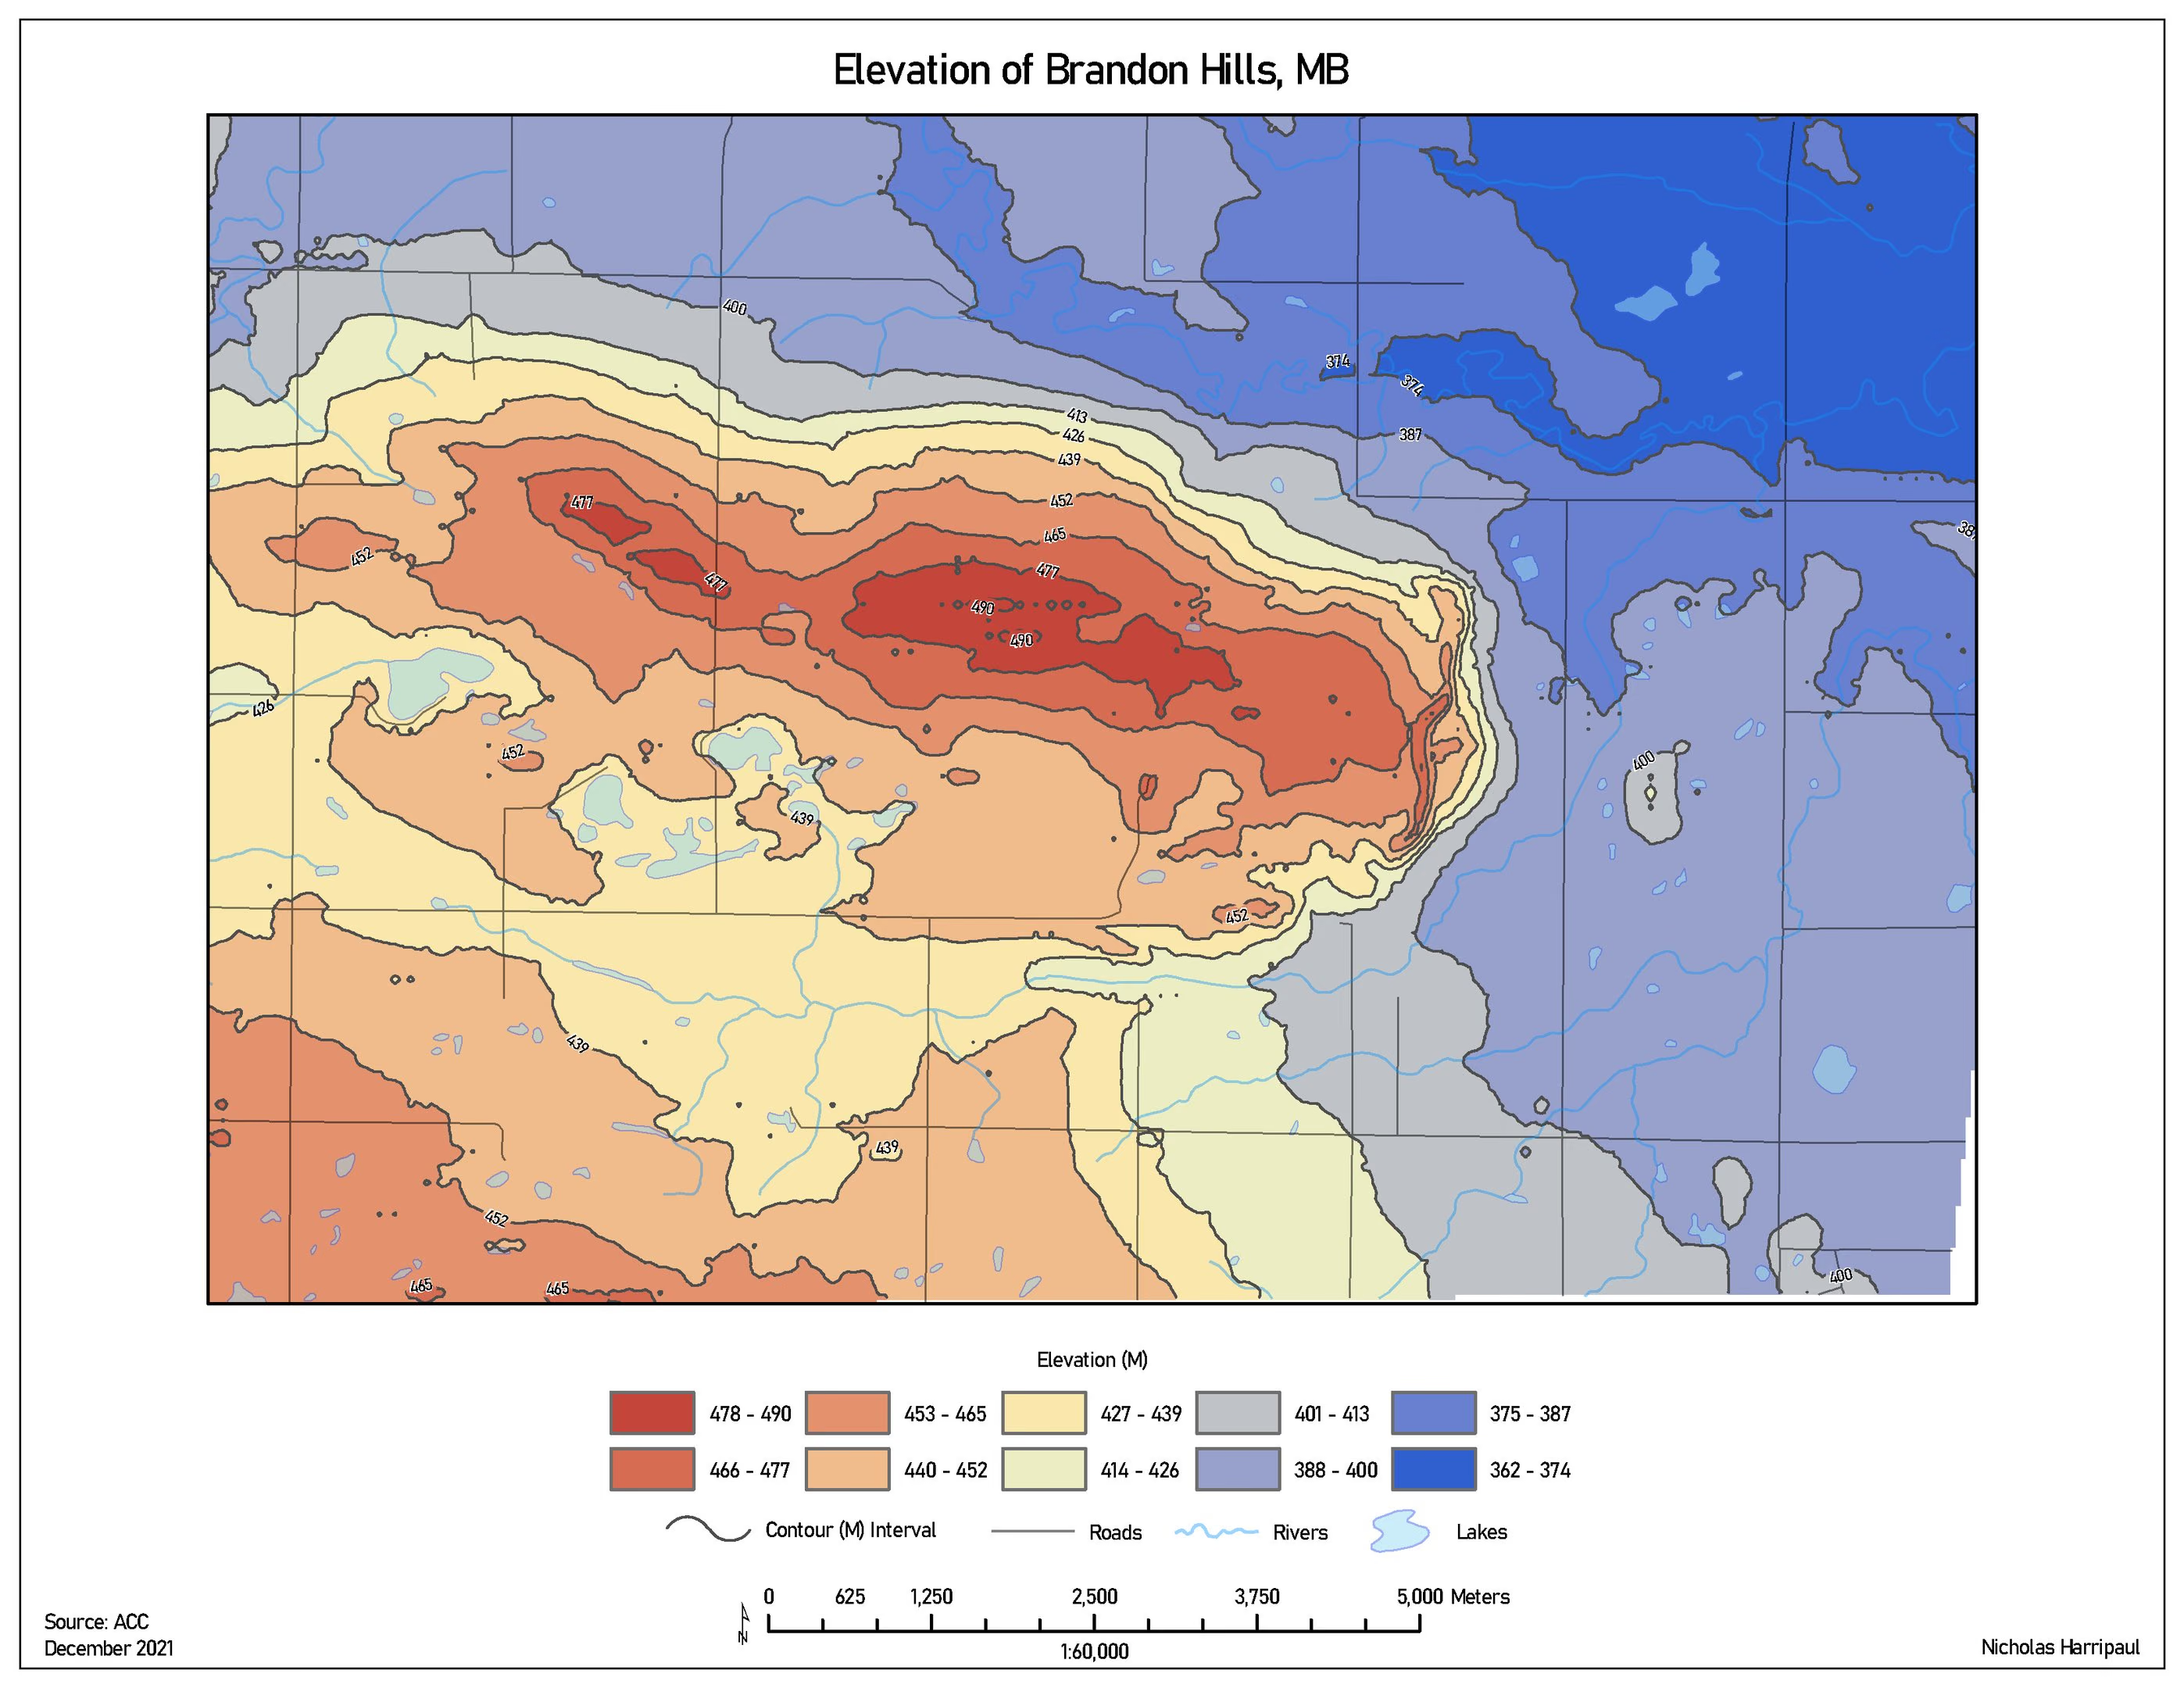
Elevation map of the Brandon Hills with contour intervals, roads and rivers, graded across a narrow 400 to 477 metre range.
Brandon Hills. The range spans under 80 metres, so the ramp is stretched to that range rather than to a provincial one.Base data: ACC. December 2021, 1:60,000Open larger (2432px)
Isarithmic map of the Brandon Hills with a terrain profile graph beneath it, plotting elevation from 420 to 440 metres across 8,000 metres of distance at 14 times vertical exaggeration.
Profile along a stated line. Vertical exaggeration is 14x and the plate says so, because a profile without that number is unreadable.Open larger (2432px)
Slope classification of the RM of North Norfolk into no slope, low, moderate and steeper classes.
Slope classes for the RM of North Norfolk.Base data: ACC. December 2021, 1:175,000Open larger (2432px)
Aspect analysis of the same municipality showing the compass direction each slope faces.
Aspect over the same area. Paired with slope, it answers which land is workable and which way it drains.December 2021, 1:200,000Open larger (2432px)
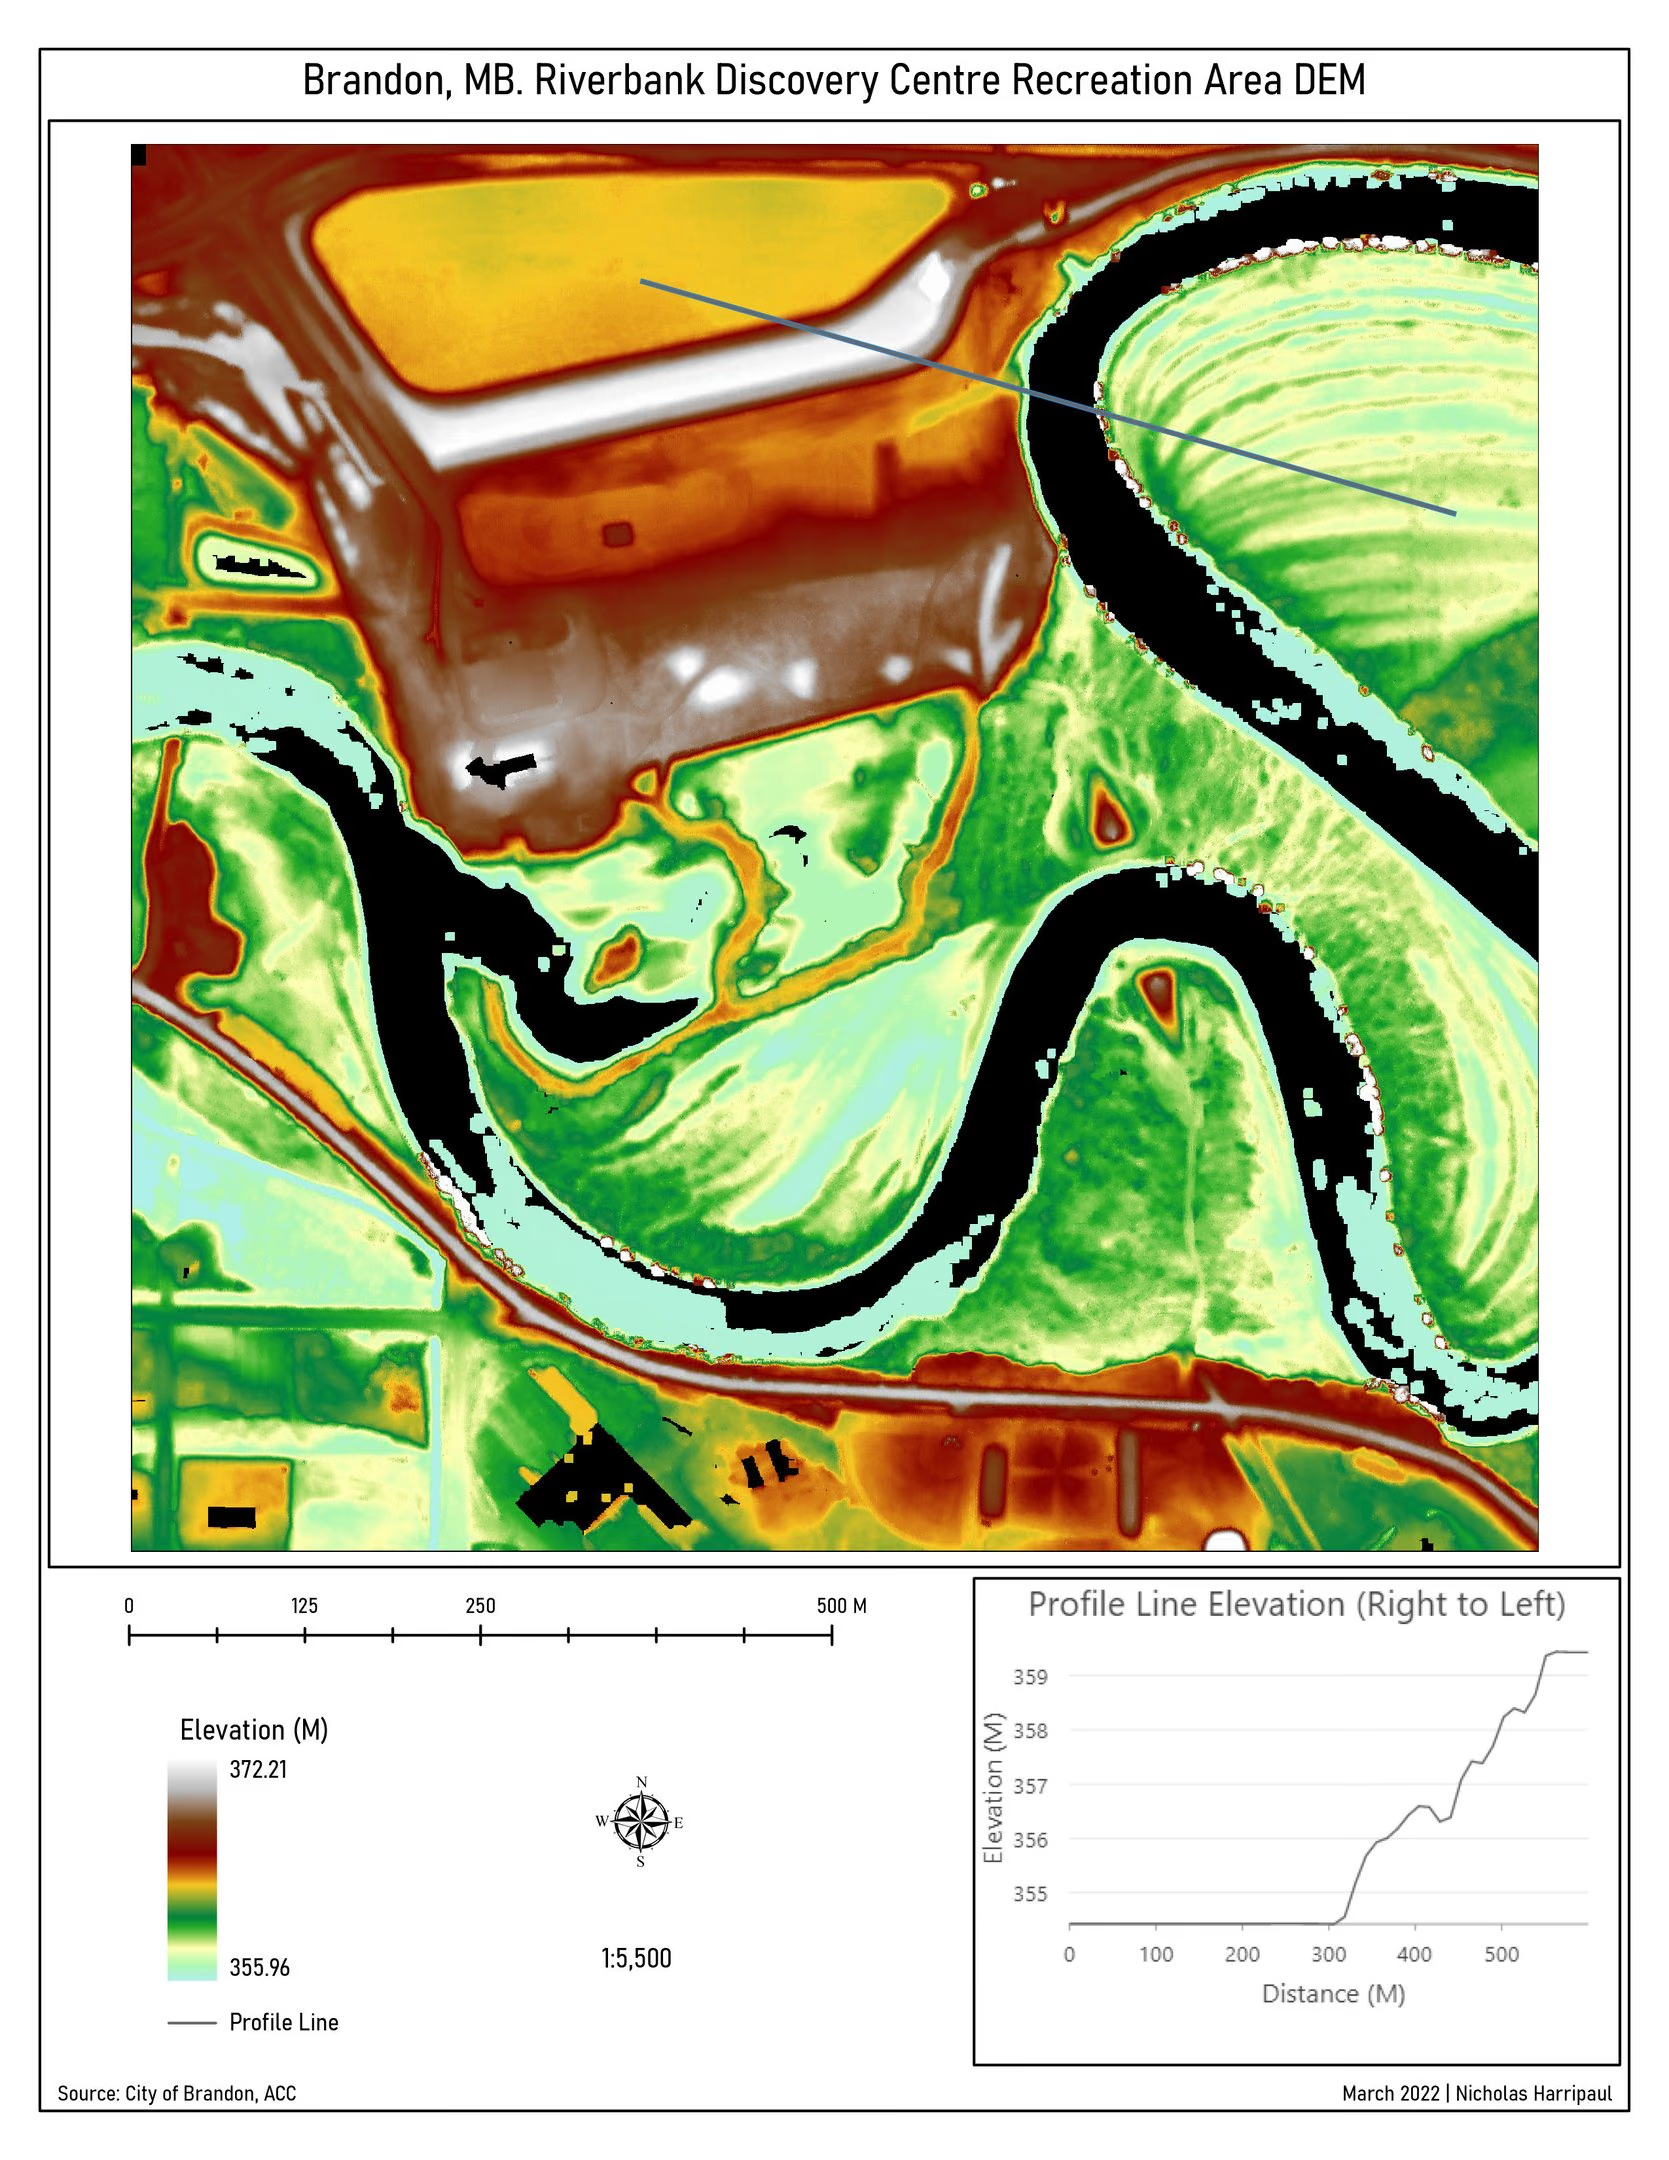
Fine-scale elevation model of the Riverbank Discovery Centre recreation area in Brandon at 1 to 5,500, with a profile line drawn across it.
Riverbank Discovery Centre at 1:5,500. At this scale the river terrace structure is the subject rather than the backdrop.Base data: City of Brandon, ACCOpen larger (1669px)
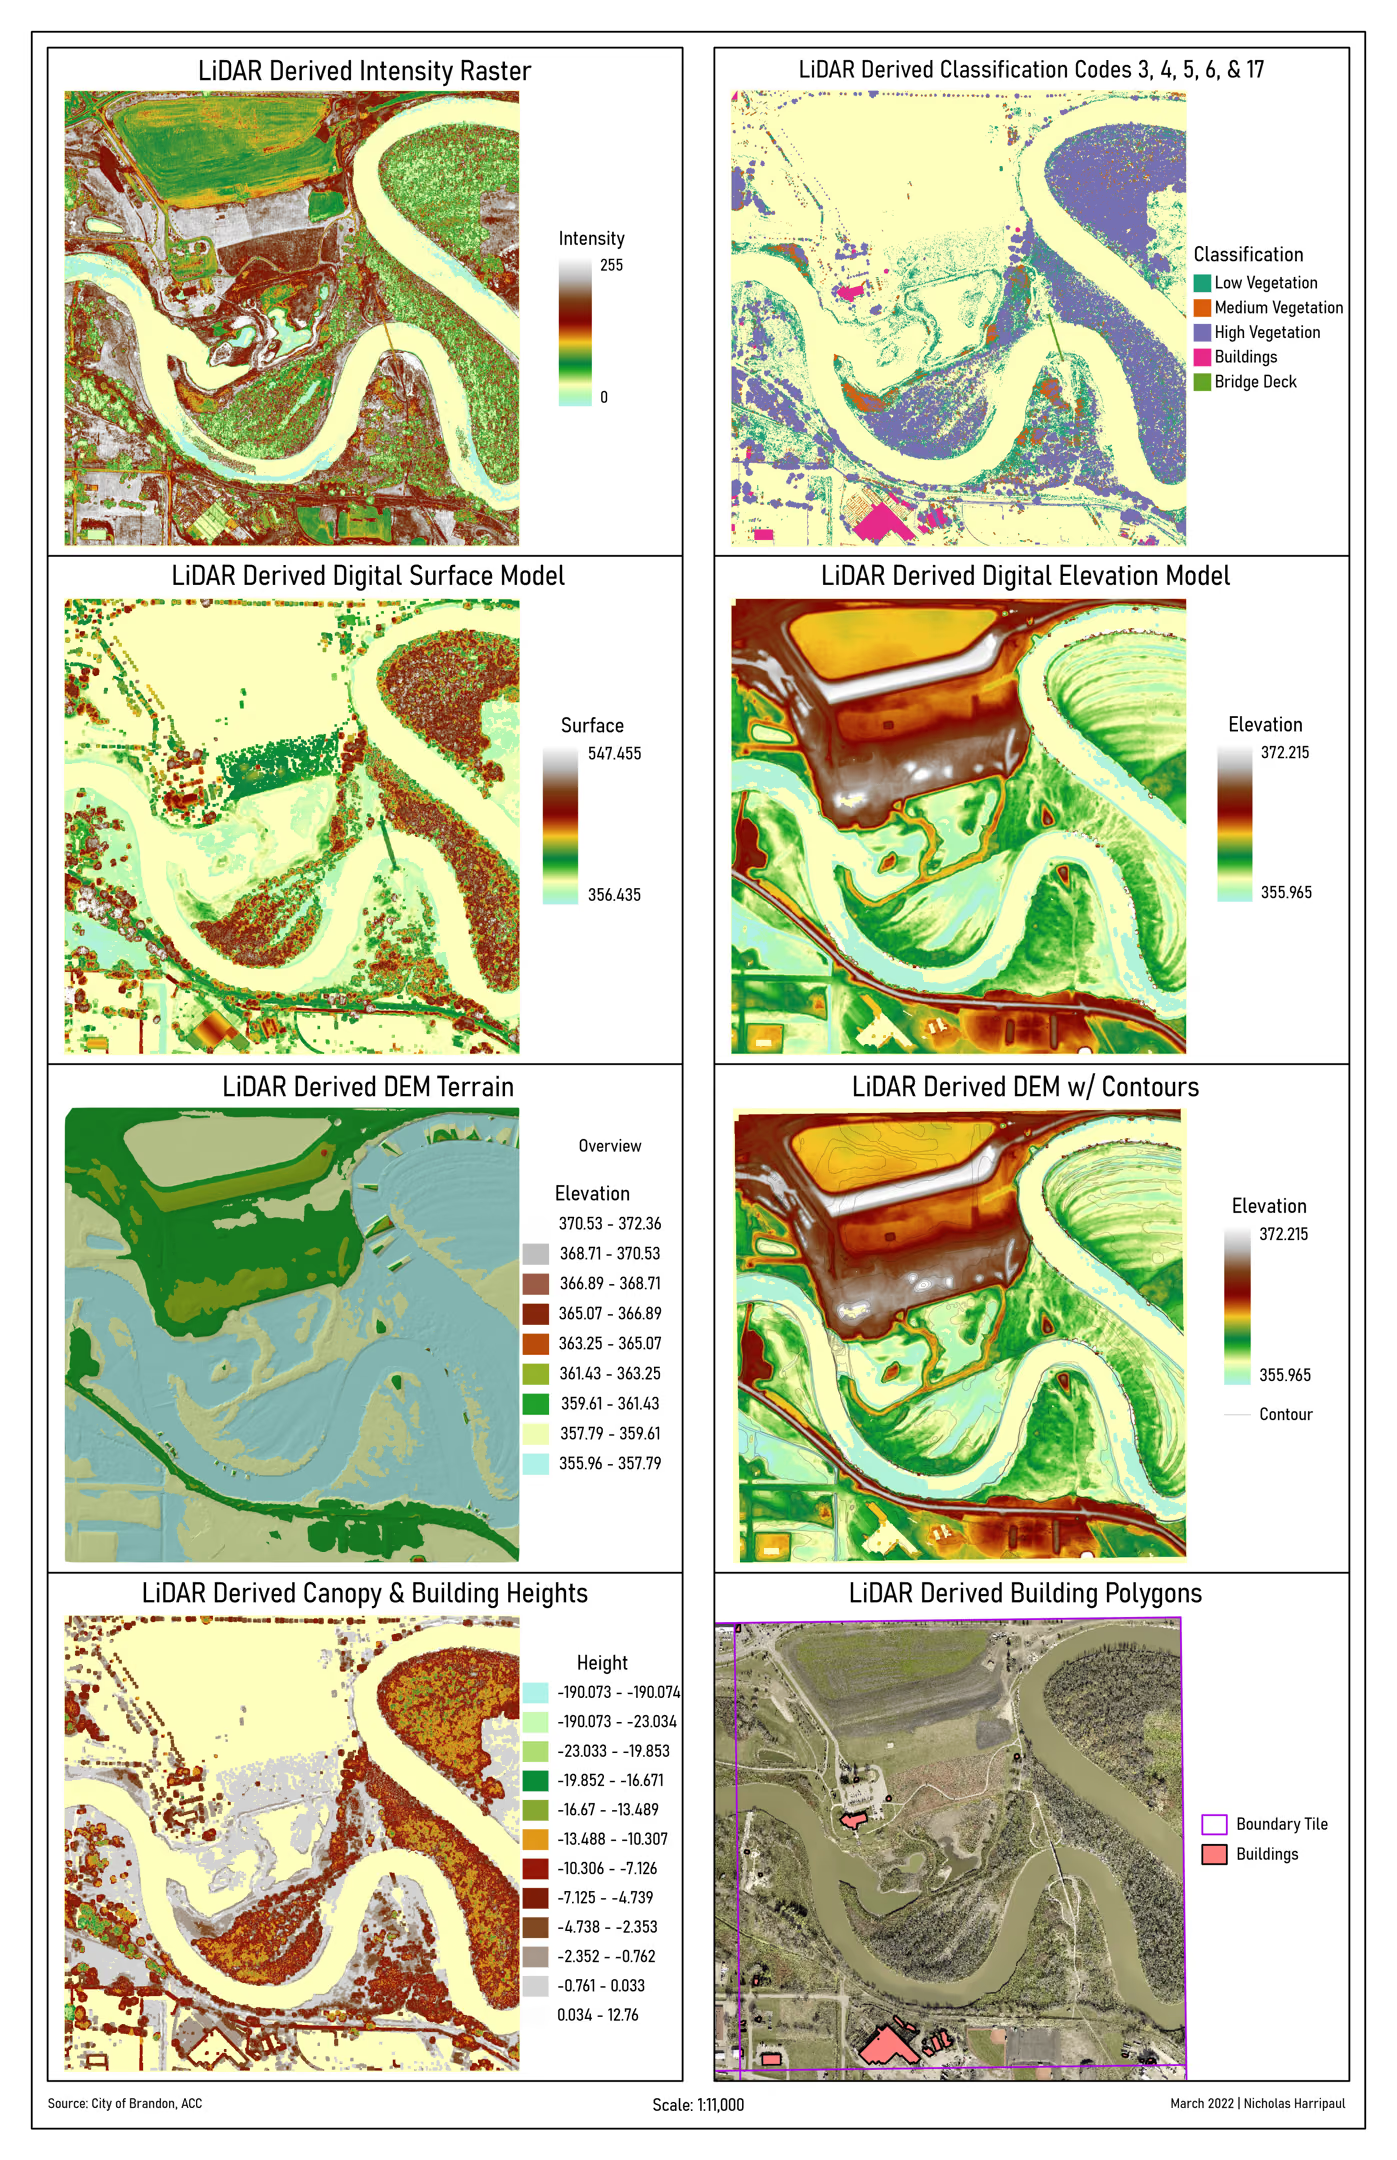
Derived terrain surfaces for the same recreation area with values from negative 7.1 to 12.8, over an aerial photograph for context.
Derived surfaces over the same ground, with aerial imagery alongside for reference.Scale 1:11,000Open larger (1397px)